ON–038: DeFi
Sep 11, 2020

This is issue #38 of the on-chain analytics newsletter that reaches 5000 crypto investors every week 📈
As fundamentals grow increasingly important in crypto investing, it’s becoming paramount for projects to have data-driven community members capable of evaluating network health. The trouble is, reaching these people is not exactly easy for projects.
It’s also difficult for fundamentals-focused contributors to uncover new and exciting projects. And when they do, there is often a lack of educational materials that make it difficult to get started.
Which is why today I’m excited to announce a new collaboration with RabbitHole that will give our subscribers a new educational portal that introduces them to the most exciting networks in the space, plus make it easier for projects to connect with our data-driven community.
The best part? Incentives. Readers will receive rewards in the form of tokens for completing tasks on the Our Network ✘ RabbitHole portal.
If you’re interested in participating in our first campaign next week, please fill out this typeform.

This week our contributor analysts cover ETH Gas, Chainlink, and Numerai.
Contributor: Blaise Cavalli, CEO and co-founder of Nyctale
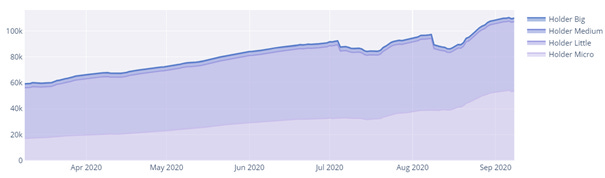
- Chainlink has continued its impressive growth of attracting new long-term investors. There are now 100k wallets labeled as long-term investors and a total of 150k wallets with a balance of greater than 10 LINK. This growth is mainly fueled by wallets having less than 1k tokens in their balance (“Micro” label), and wallets holding between 1 to 10k tokens (“Little” label).
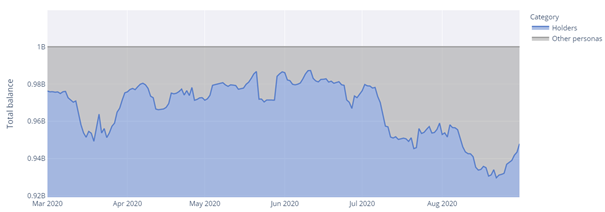
- Although the number of holder wallets is growing, the amount of tokens held by long-term investors has been decreasing all along the last few months. Around 50M tokens have moved from these wallets, which means there are more tokens circulating on the market.
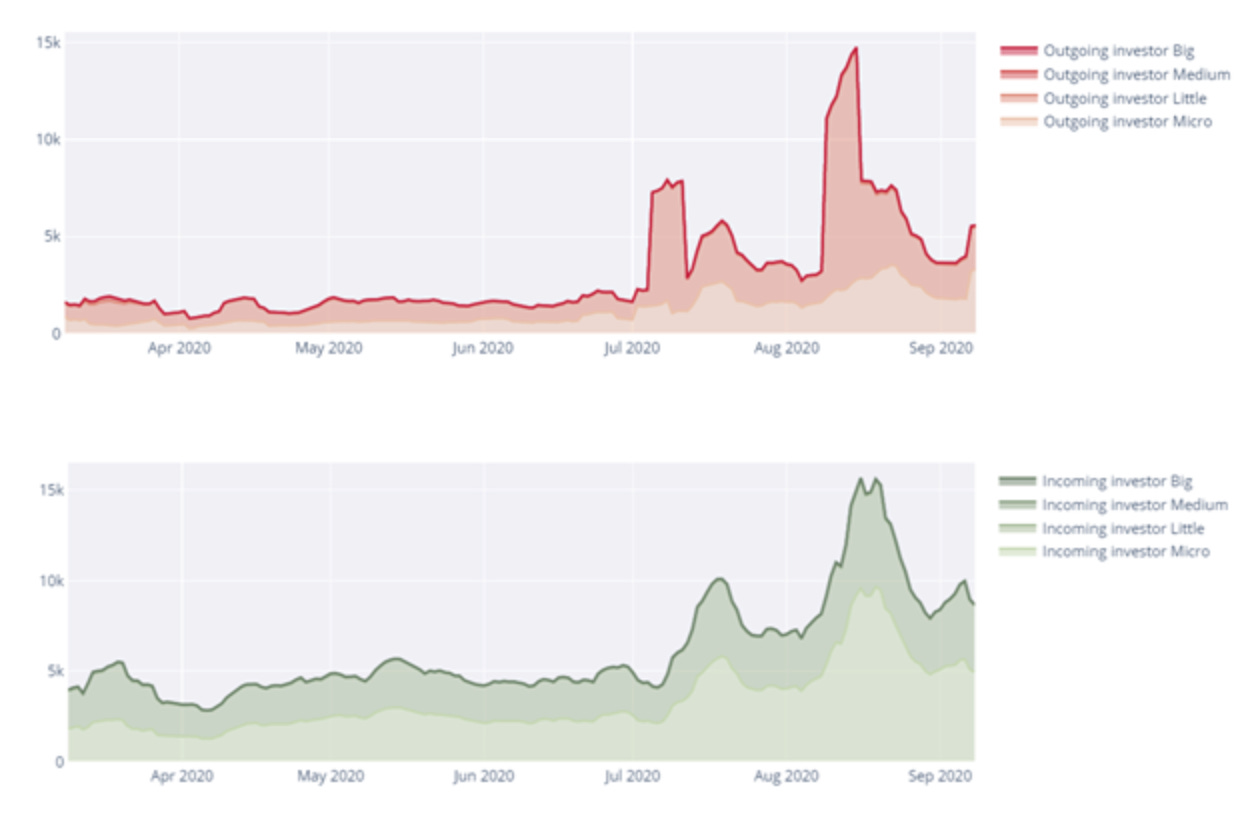
- During the recent price spike, we identified groups of wallets cashing out parts of their positions. These were mainly holding between 1k and 10k tokens (“Little” category). In parallel, many small investors (buying less than 1k tokens) joined the LINK community during this highly speculative period. Figures 3 and 4 below show the number of outgoing and incoming investors on LINK over the past few months:
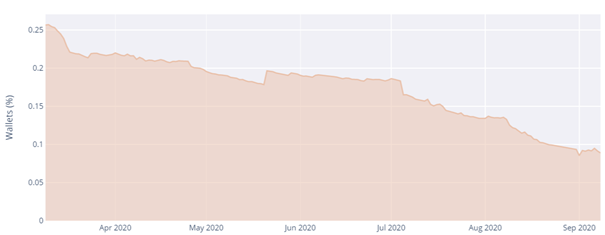
- Surprisingly, the concentration of wealth in this period has significantly increased, moving from 0.25% for all wallets holding 90% of the total supply to 0.1% in the last 6 months. This means that while middle size investors enjoyed the price spikes to cash-out with a new wave of small investors, whales have kept consolidating their position in parallel. Figure 5 shows the 90% wealth concentration indicator for LINK:
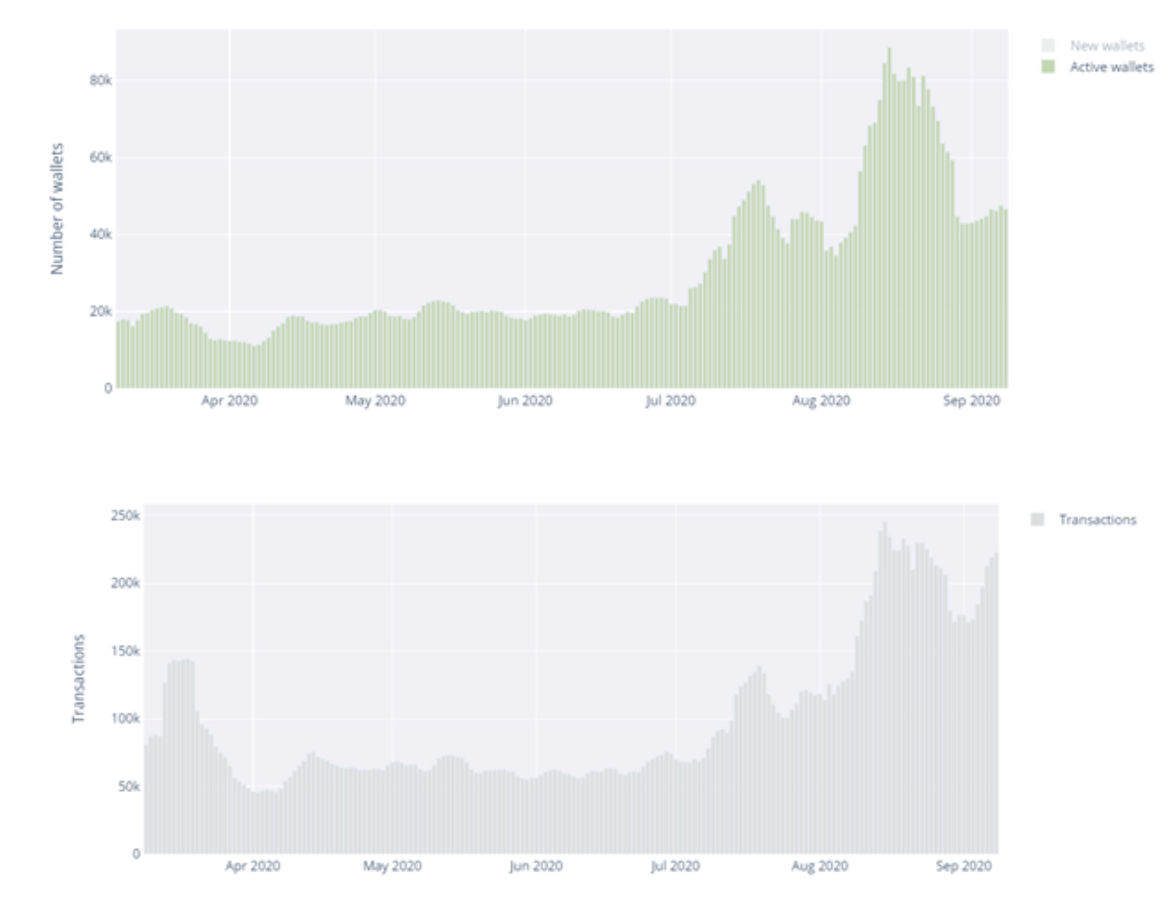
- Finally, active wallets and on-chain transactions are also on the rise, as there are now more than 40k active wallets responsible for 200k transactions on a weekly basis. This represents 100% quarterly growth for active wallets and +200% quarterly growth for on-chain transactions.
Contributor: Professor Aleksandar Kuzmanovic, Co-Founder & Chief Architect at bloXroute Labs
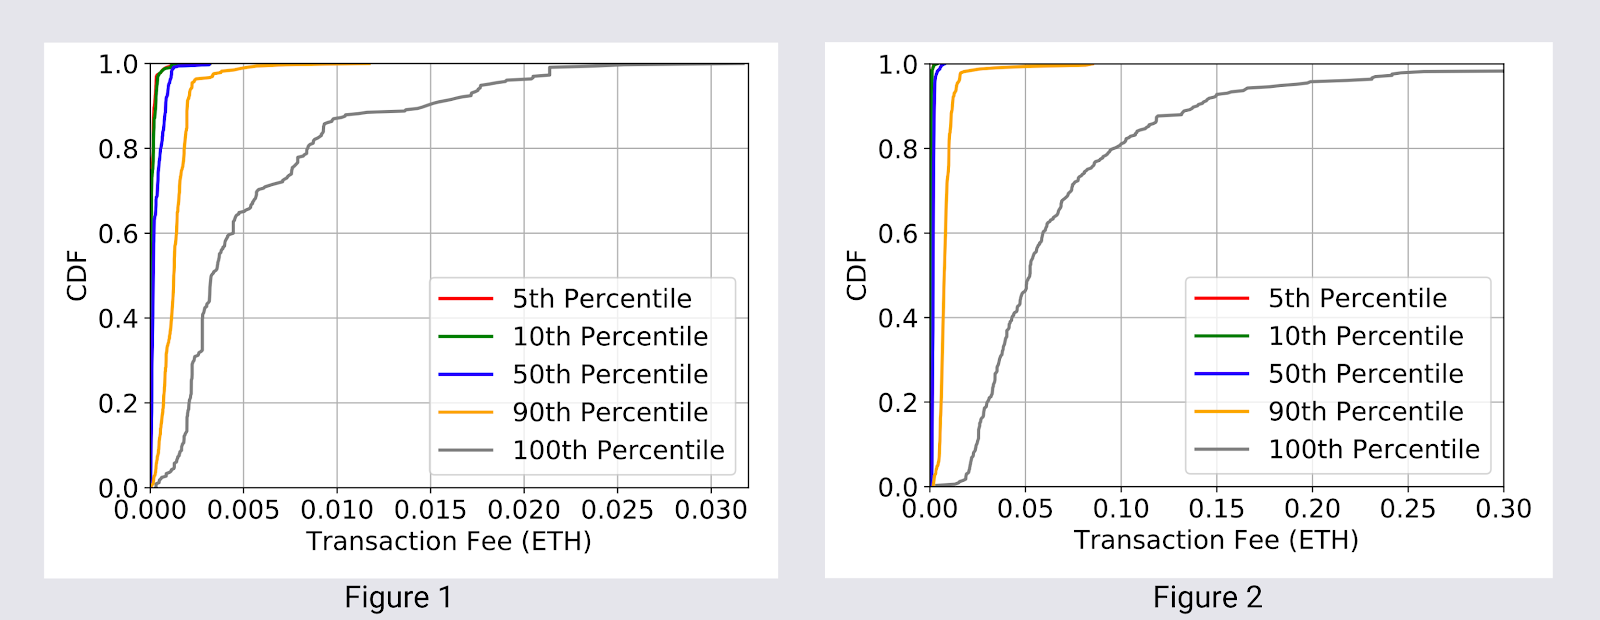
- This analysis compares Ethereum fees across two periods: a week in January 2020 and a week in August 2020.
Absolute and relative fees. Over the two week period examined, fees in Ethereum have increased ~10x and the ratio between the highest fee paid and the bottom 5% remained constant. However, while users are paying more gas fees in absolute terms, some users are paying less in relative terms (i.e. not overpaying as much). The key is to have accurate and timely transactions data and services. bloXroute provides a set of transaction APIs that help users optimize their fees.
Figures 1 and 2 show the distribution of (absolute) Ethereum fees. While the shapes of the curves are similar, the x-axis in Figure 2 is 10x that of Figure 1. Hence, the fees in Week 2 are approximately 10x higher relative to Week 1.
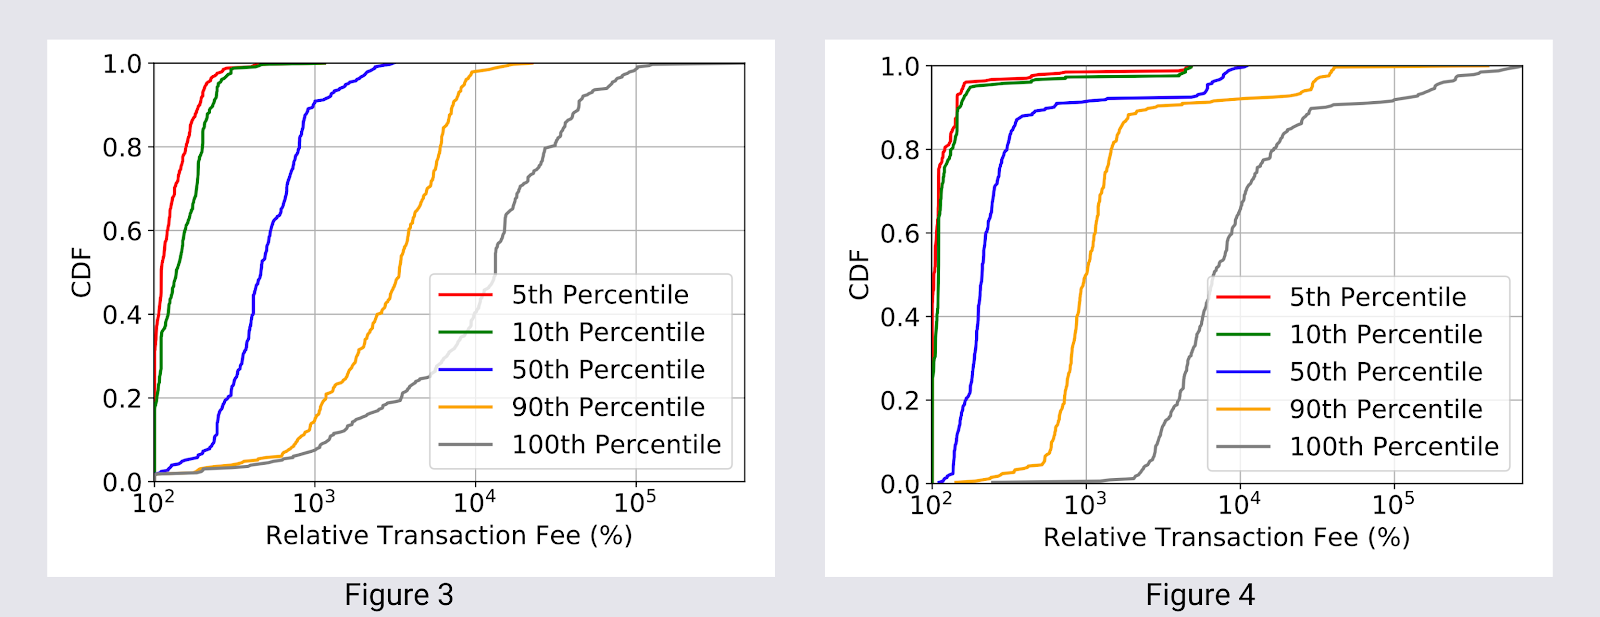
From analyzing the two week period, we found that during high-fee periods, more users tend to optimize their fees. Figures 3 and 4 show the fees across the two weeks, relative to the bottom 5th percentile fee in a block. In both scenarios the ratio between the 100th percentile (the highest fee) and the 5th percentile, is approximately 100x.
However, the important insight is the 50th percentile fee (blue line in the figures): In Week 1, the ratio of 50th to 5th percentile is approximately 5x in the median case, while the ratio of 100th to 50th percentile is approximately 20x. In Week 2, this changed to approximately 2x and 50x, respectively. Practically, this means that in Week 2, the half of the users that paid fees below the 50th percentile in a block, managed not to overpay too much (they overpaid by less than 2x relative to the 5th percentile).
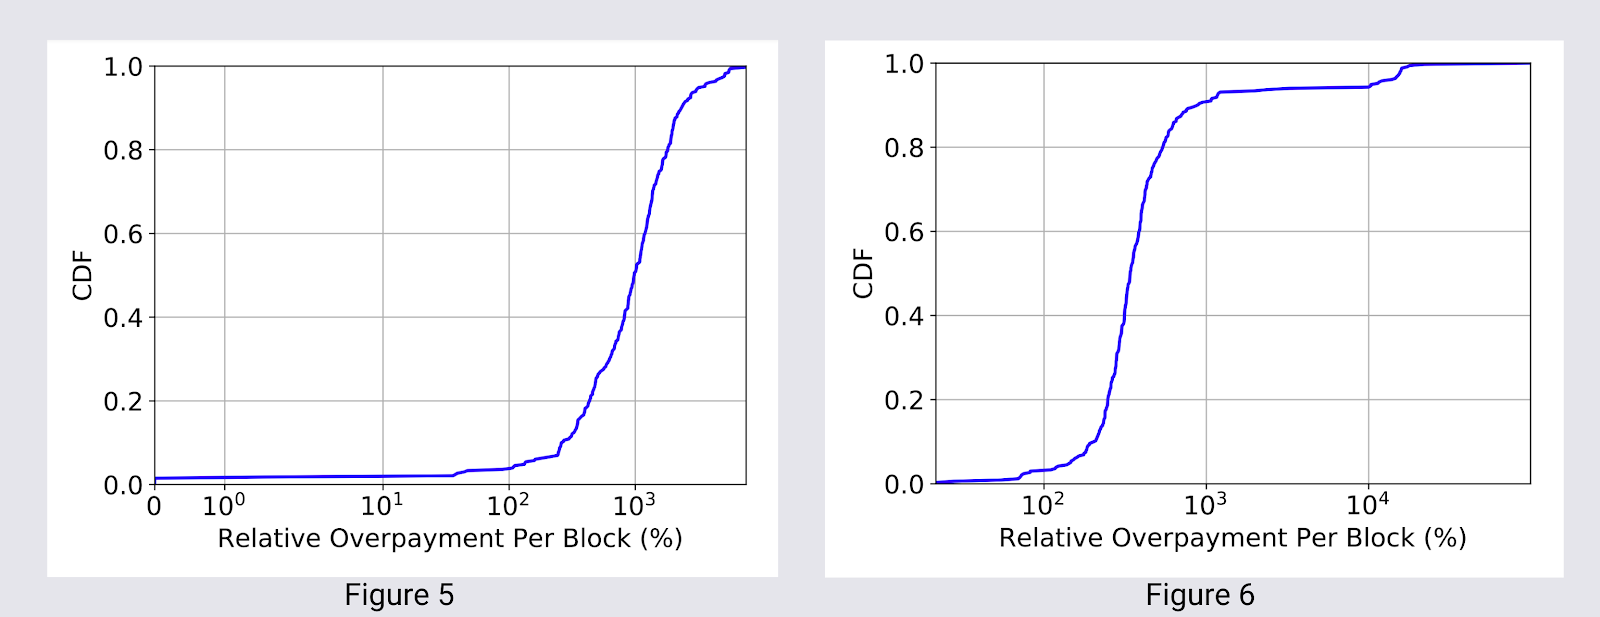
Quantifying Overpayments. Figures 5 and 6 quantify overpayments, per block, in two explored weeks. In Week 1, fee overpayments are at 1000% (10x) relative to the bottom 5% fee in the median case, while in Week 2 fee overpayments are at 500% (5x) in the median case. While this is a positive trend, much more can be done, given that a lot of money is still “left on the table,” particularly now that the absolute fees are 10x higher than they used to be.
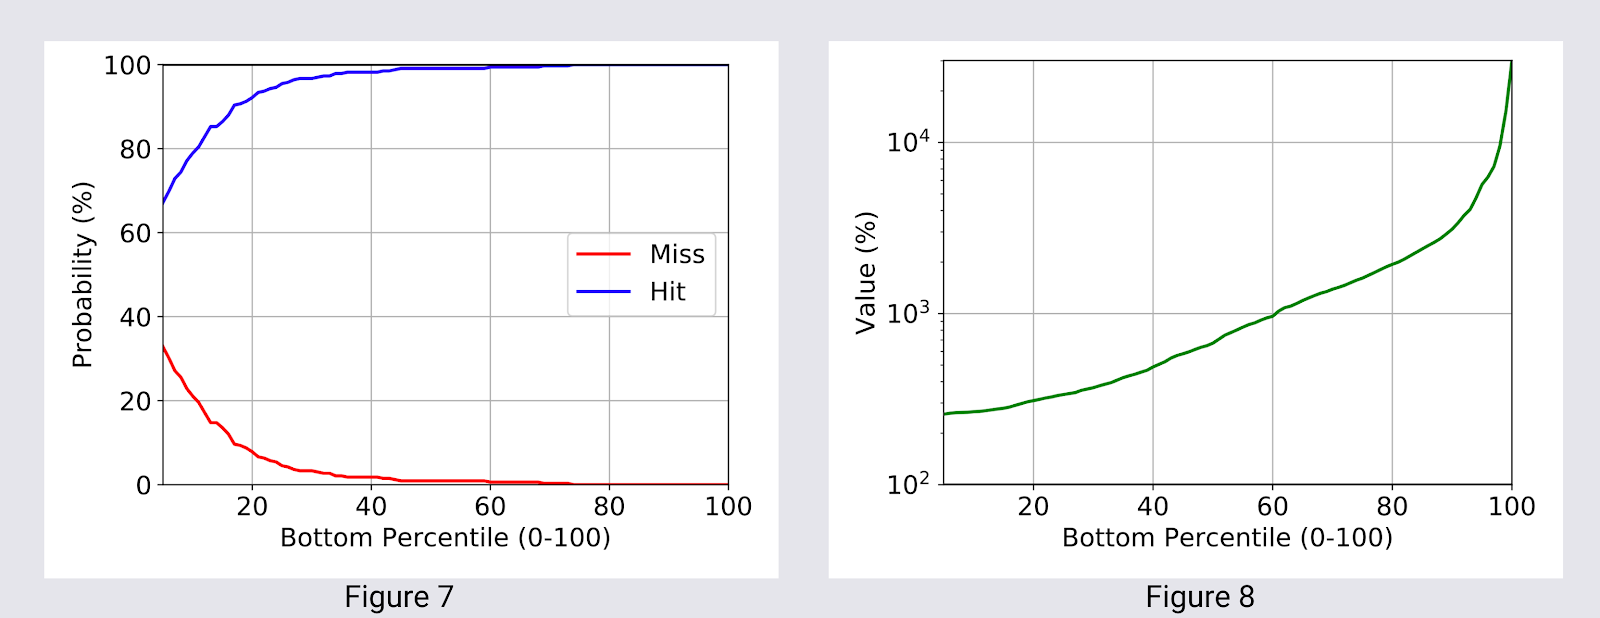
Tradeoffs in Fee Prediction. We also evaluate the effects of the timeliness of data used to predict fees in a block. To that end, we evaluate an estimator that utilizes contents of a previous block to predict fees in the next block. While our goal is to create a simple benchmark of how a slight time lag (of 12 seconds on average) affects prediction, we note that many existing predictors operate at much longer time scales.
In Figure 7 and 8, we show the results for Week 2 only. Figure 7 shows that if one repeats the minimum (5th percentile) fee from the previous block (x-axis), there is a 35% chance (y-axis) that the transaction won’t make it in the next block. Yet if it does get included, Figure 8 shows that the overpay will be ~ 20% (y-axis). On the other hand, if one chooses to pay at the 60th percentile fee level of the previous block, there is a high probability (~97%) to make it in the next block, but the overpayment is 1000% (10x) as shown in Figure 8.
This stresses the need to have accurate and timely transactions data and services. While knowing the latest block fast can help you optimize fees for the following block, knowing transactions as they occur can further help users optimize their fees. bloXroute provides a set of transaction APIs that help users address the above tradeoff: concurrently save on fees and reduce the miss probability to close to zero.
*For each mined block evaluated, we exclude the bottom 5% of fees given that they can often be too low and bias the results.
Contributor: Omni Analytics Group
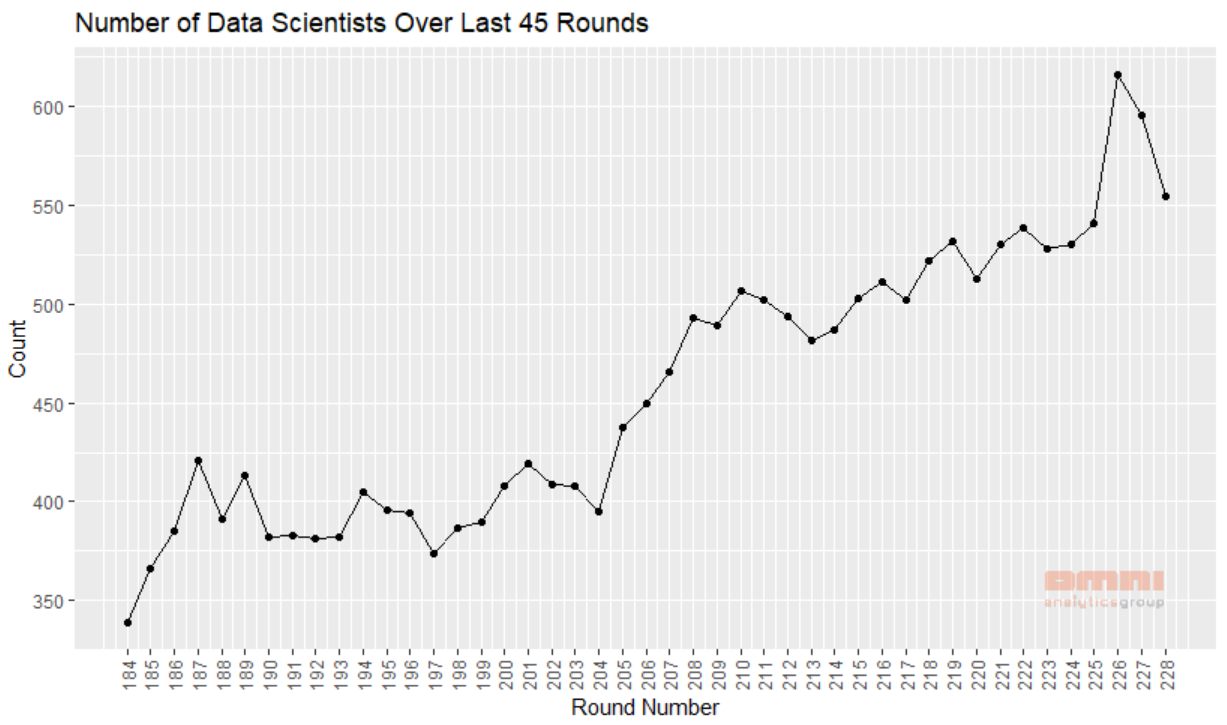
- Numerai hosts “the hardest data science tournament on the planet” as a weekly competition where users build machine learning models that forecast outcomes on financial assets. Since before 2017 and now into its 228th round, the tournament has seen steady growth in the number of data scientists signed up to participate.
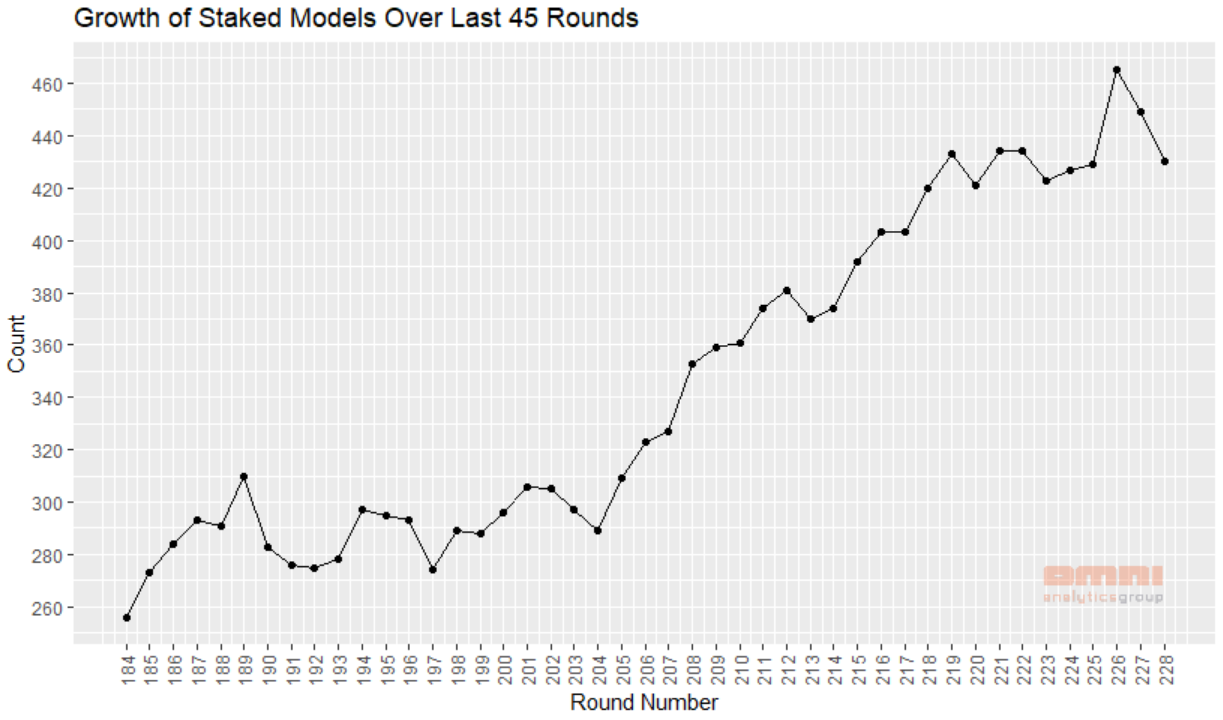
- Over the last 45 rounds, not only has the number of data scientists grown, but an increasing number of tournament participants have been staking Numeraire on their models. The process of staking involves the data scientist locking a portion of their Numerarie holdings into an Ethereum contract. This serves as a signal of the level of confidence they have in their model predictions for a given round. At the end of each round, models are rewarded additional tokens depending on the quality of their results and the amount staked.
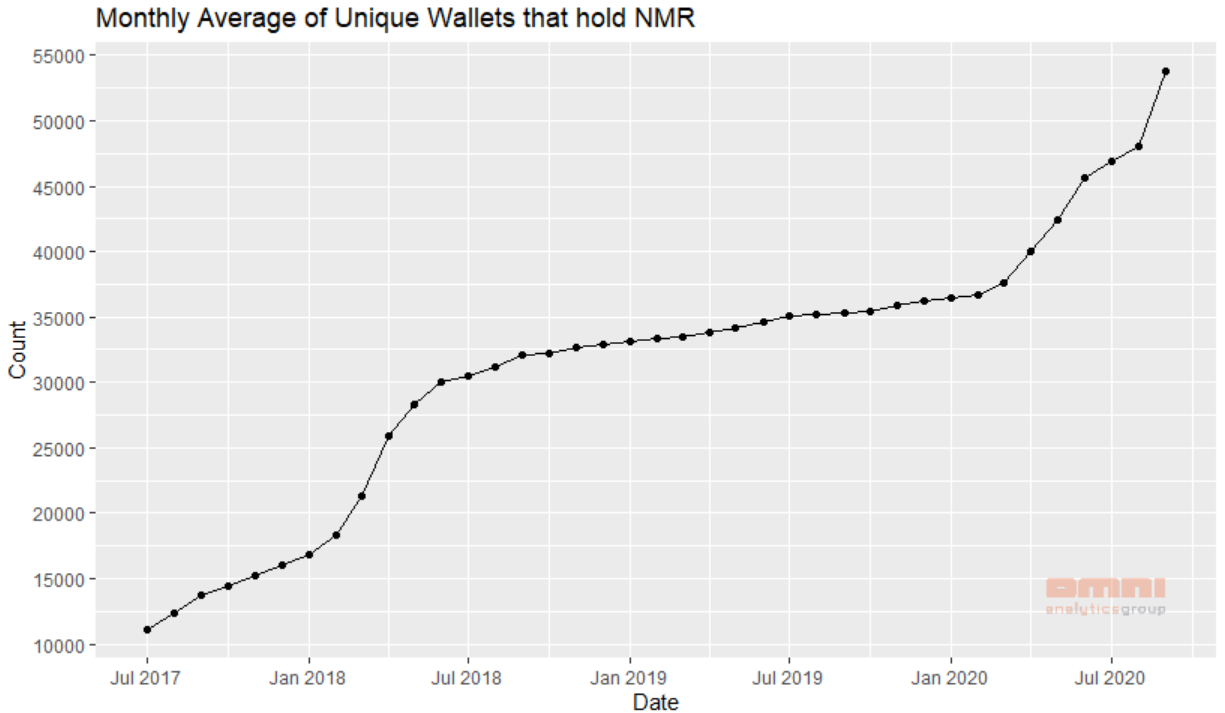
- Through the release of Signals and ErasureBay, Numerai has been expanding the utility of its Numeraire token and this is reflected in the growth trend of the number of unique wallets now owning the token. Since summer of July over 40,000 new wallets began holding Numeraire, with a large spike of nearly 5,000 in the summer of 2020 after a series of partnerships were announced.