ON–010: Layer 1s
Feb 28, 2020

Welcome to Issue #10 of Our Network, a weekly newsletter where top blockchain projects and their communities share data-driven insights and advanced metrics.
Before we get into this week’s network updates, I wanted to take a brief moment and thank you for being a subscriber to Our Network. Like so much in the blockchain space, this is a community-driven effort — readers included.
To that end, I’m pleased to announce that we have partnered with PoolTogether, the prize savings protocol, to give away free tokenized tickets to readers as a thank you for being a part of the Our Network community.
Your ticket is eligible to win a prize each and every week (it’s currently $1339). It’s also newly tokenized, which means it can be combined with other DeFi primitives to create interesting applications.
Now let’s dive into some crypto advanced metrics!
This week our contributors cover Layer 1 cryptocurrencies:
- Bitcoin
- Decred
- Ethereum
- Tezos
Contributor: Nate Maddrey, Research Analyst at Coin Metrics
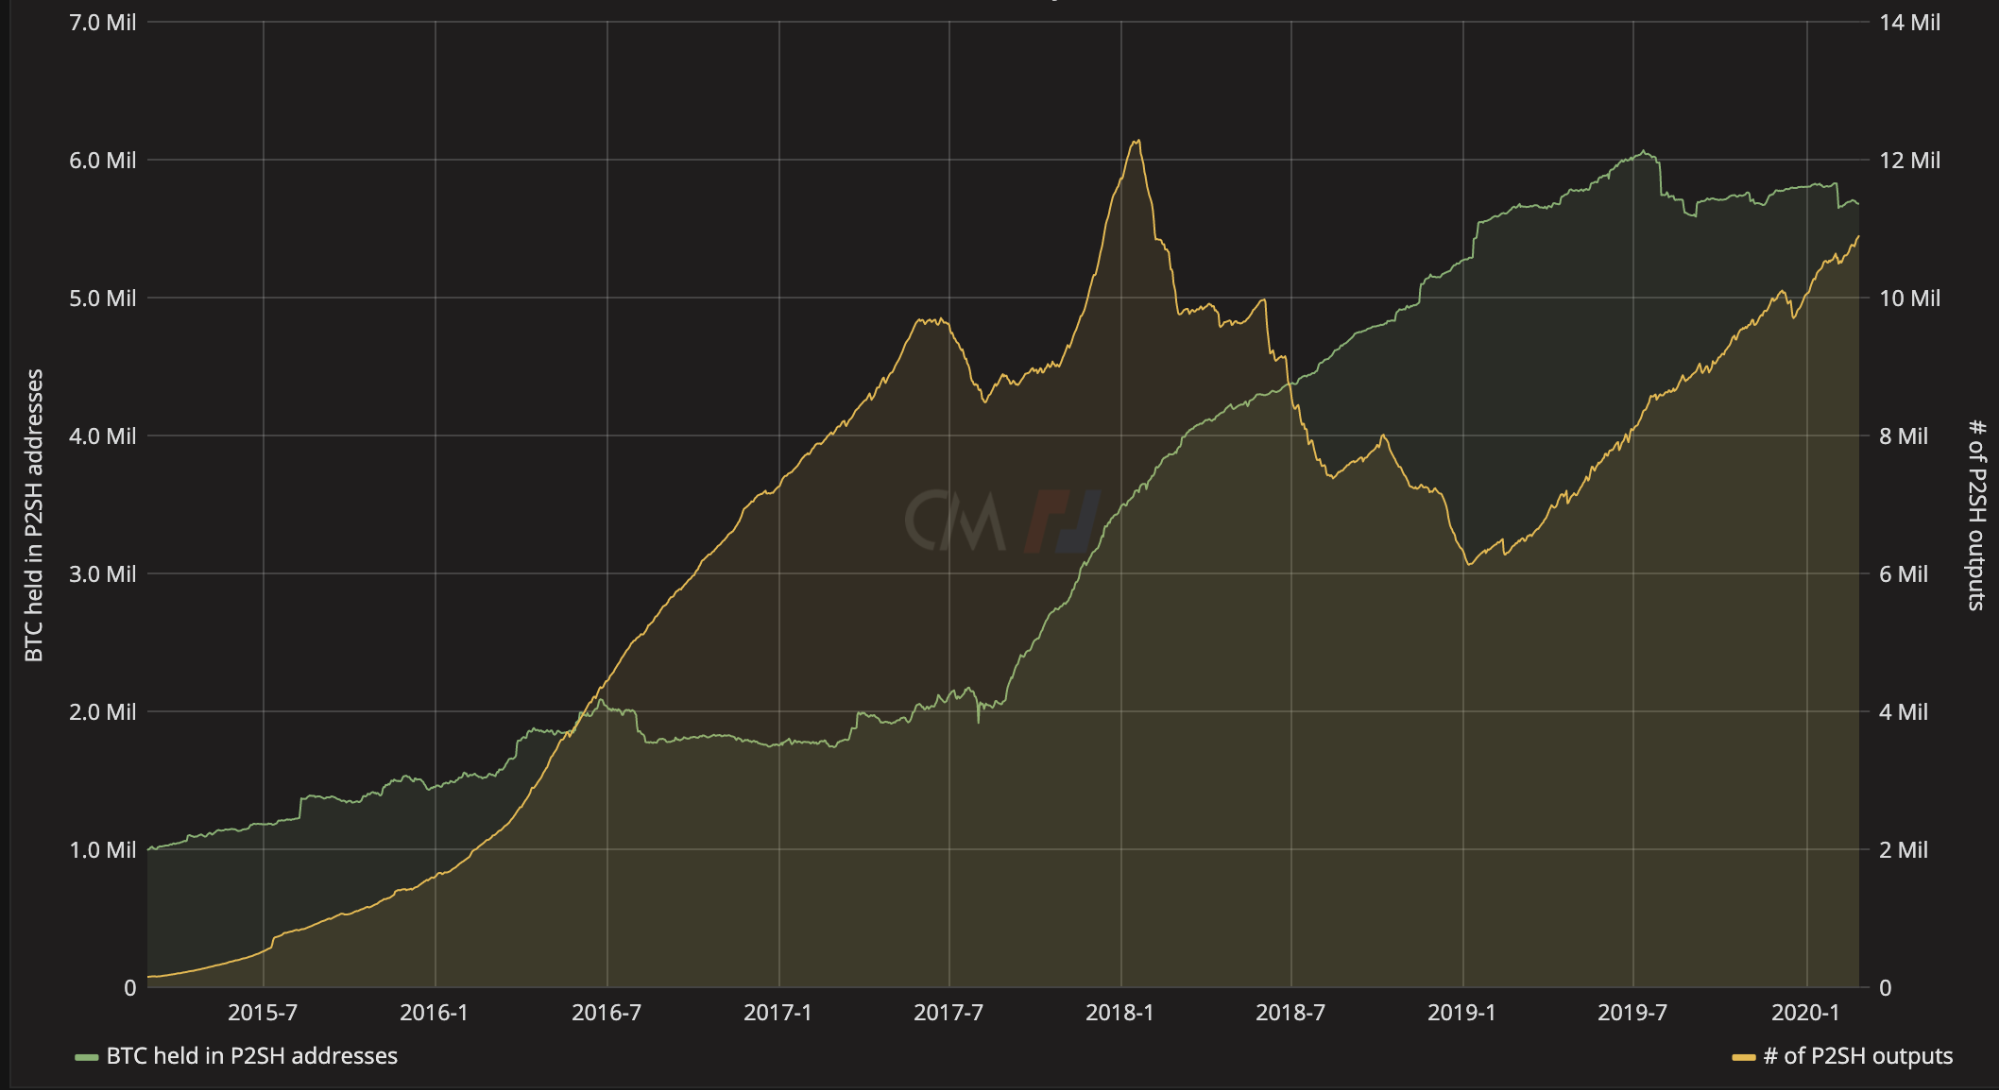
While standard Bitcoin Pay-to-PubKey Hash (P2PKH) addresses are unlocked using a private key signature, Pay-to-Script Hash (P2SH) addresses can have more complex unlocking requirements. P2SH scripts can be relatively simple, like a 2 out of 3 multisignature script, or completely unique and custom.
Usage of P2SH addresses has been steadily increasing over the last five years. Today, there is almost 5.68 million BTC held in P2SH addresses, close to the all-time high. Additionally, the number of P2SH outputs has been growing over the past year after peaking in early 2018. As of February 20th, there were about 10.9 million P2SH outputs.
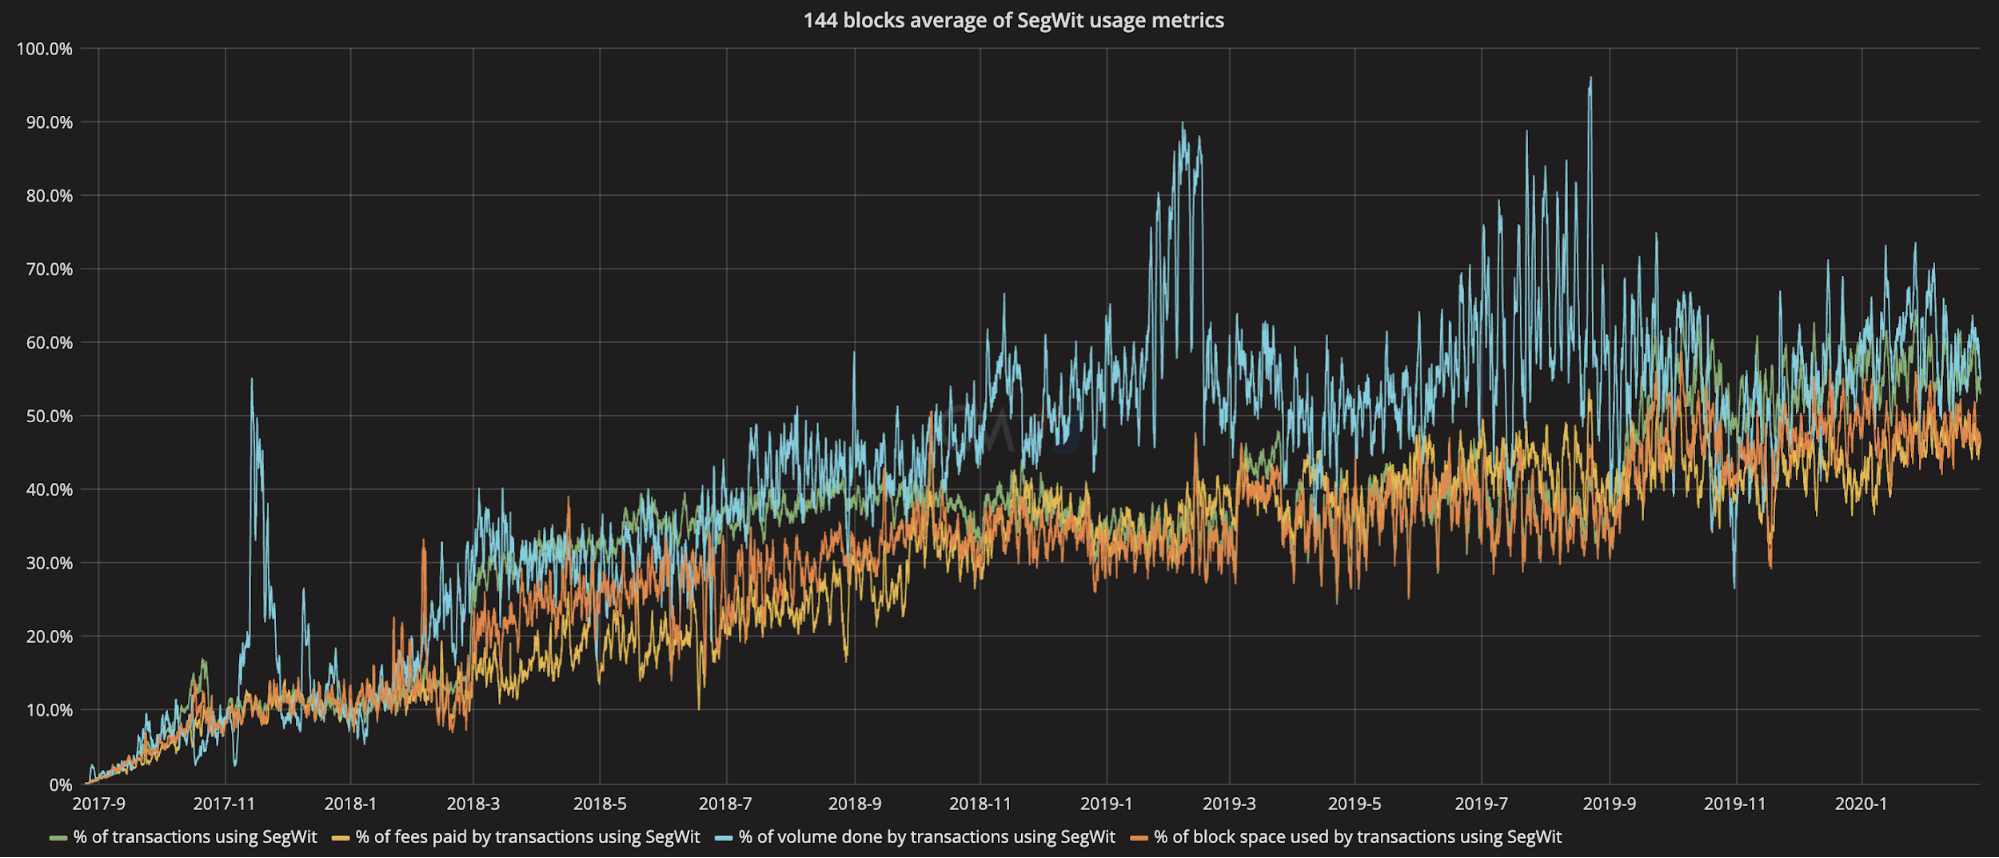
- Segregated witness (SegWit) usage has also been steadily growing. SegWit was introduced in August 2017 to address block size limitations and transaction malleability. Since then, SegWit usage has increased every year. On January 1st, 2020, about 55% of Bitcoin transactions were using SegWit, compared to about 35% on January 1st, 2019. Both the SegWit and P2SH charts are sourced from txstats.com, which is a collaboration between Coin Metrics and BitMEX Research.
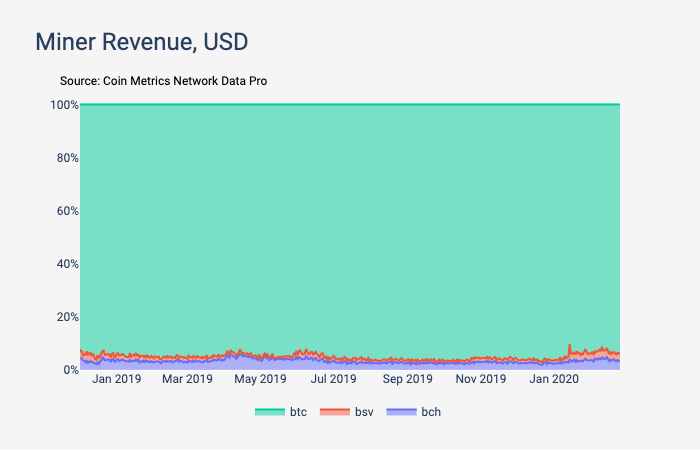
- There have been many forks of Bitcoin over the years, but Bitcoin still remains the dominant chain by most measures. Compared to Bitcoin Cash (BCH) and Bitcoin SV (BSV), the two largest Bitcoin forks, Bitcoin accounts for about 94% of the aggregated miner revenue (i.e. block rewards + fees).
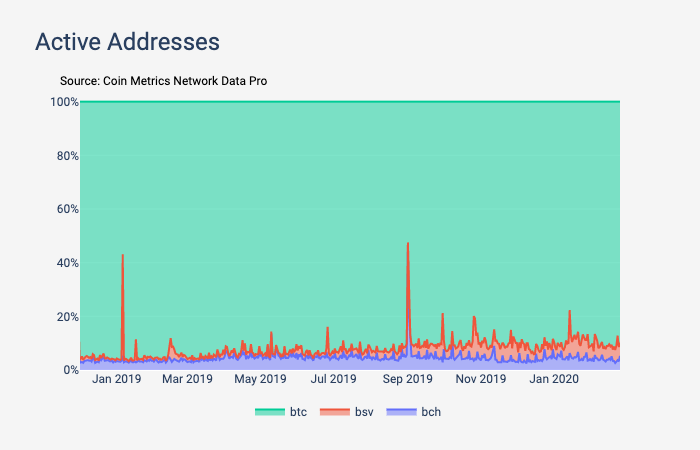
- Similarly, most usage has remained on Bitcoin. As of February 25th, Bitcoin has about 90% of the combined total daily active addresses for the three chains.
Contributor: Checkmate, Decred contractor
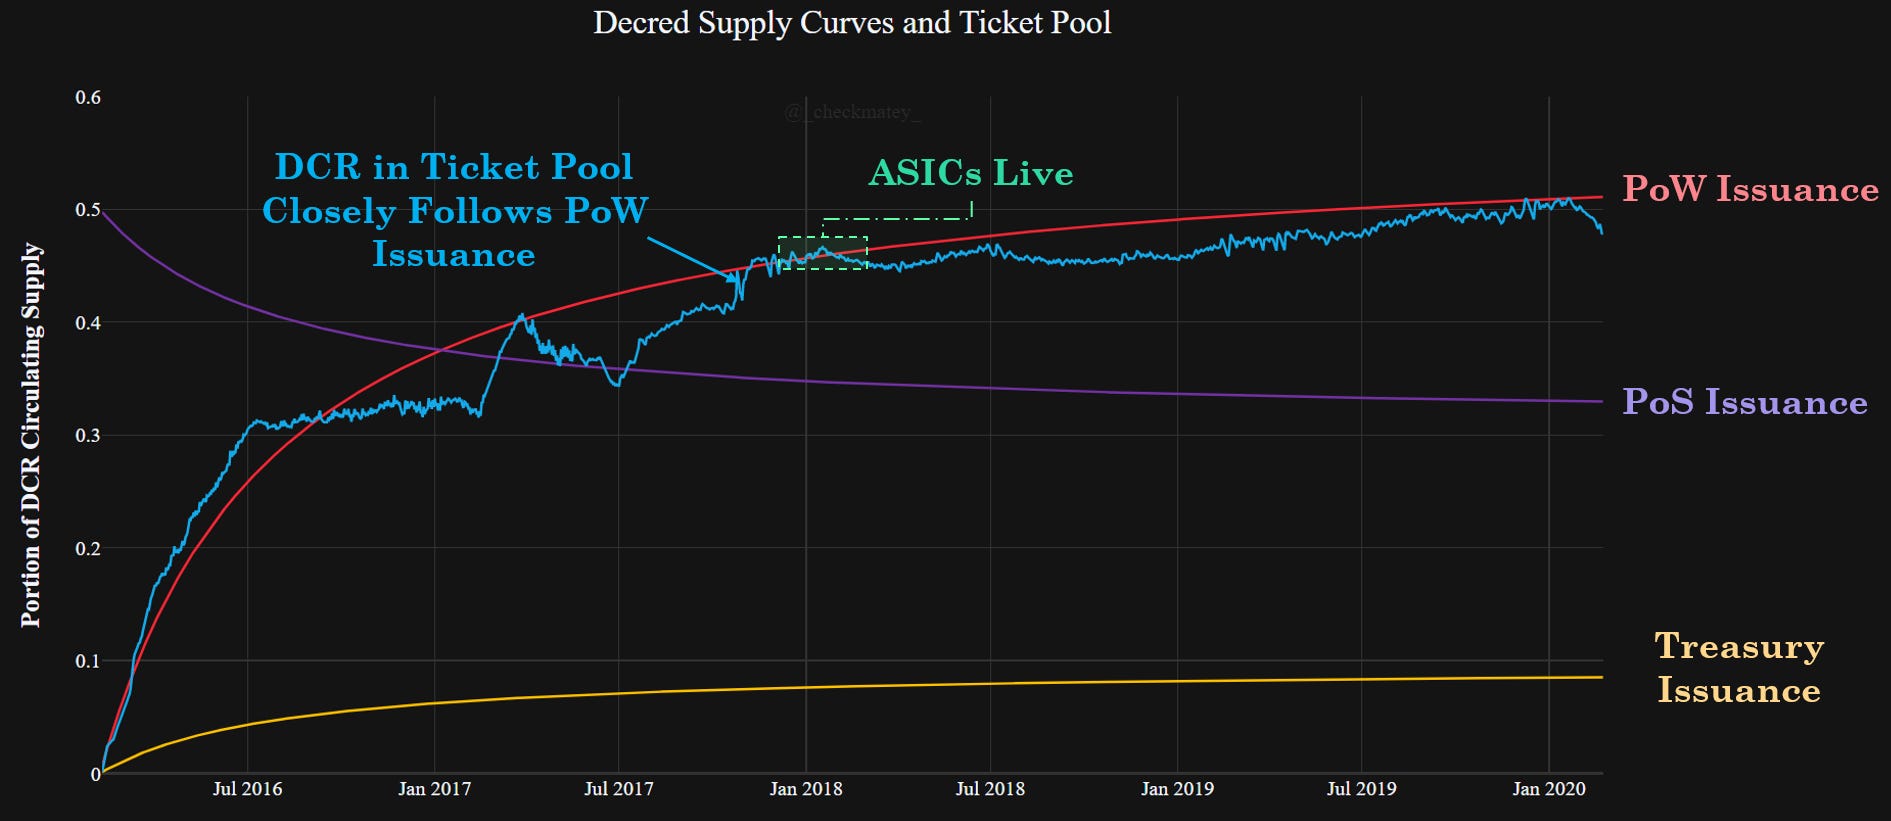
- Decred has three issuance paths for new coins, 60% are mined via PoW, 30% are staked by PoS and 10% allocated to the Decred Treasury. The chart below shows these issuance curves alongside the total DCR bound in tickets (Y-axis is proportion of circulating supply). It shows a very distinct relationship between DCR in tickets (blue) and PoW issuance (red). This suggests that a majority of coins distributed by miners have been purchased by market participants, and make their way off exchanges into staking. This trend has persisted both before and after ASIC miners launched on the network and is one indicator that DCR has a reasonable and fair coin distribution.
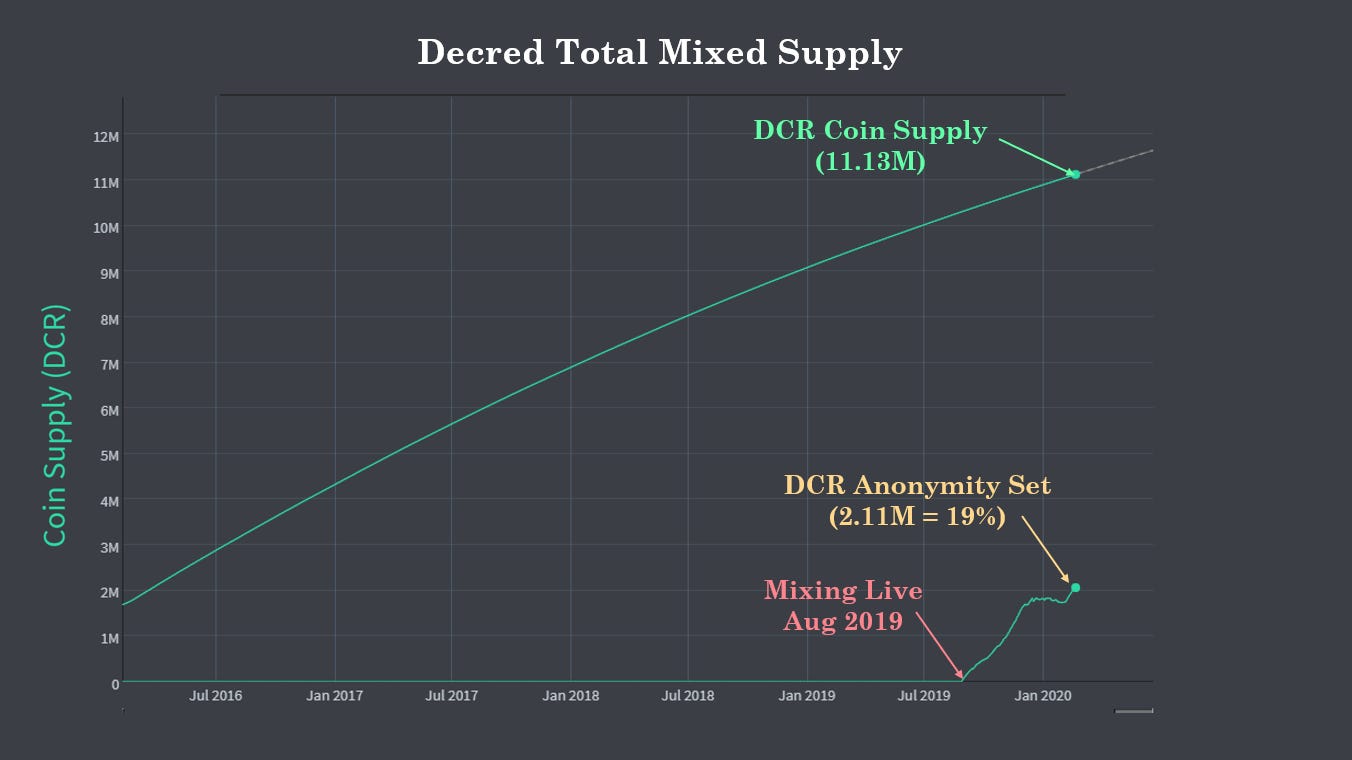
- The Decred privacy implementation has been live since late August 2019 and has been met with strong reception and usage. The system facilitates coin-join mixing using the CoinShuffle++ protocol, combined with the constant flow of DCR in tickets. The supply of mixed DCR has resumed its uptrend after rolling out further stability upgrades for the mixing server allowing wider participation. The set of mixed coins now represents over 19% of all circulating Decred UTXOs (2,113,530 DCR). Note, this counts all mixed UTXOs (incl. tickets) which have not been spent since the mix.
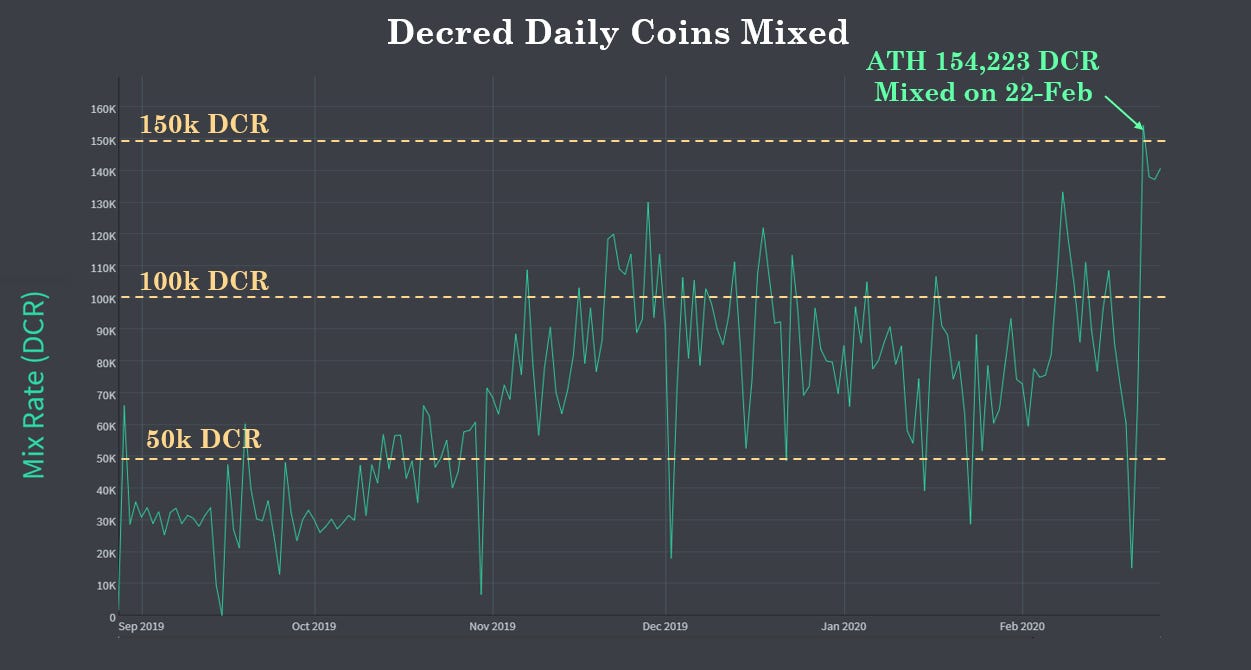
- Current volumes passing through Decred coin-joins are consistently between 50,000 and 100,000 DCR per day. At recent prices of $20, the protocol is mixing between $1 to $2 Million in value per day. On the 22-Feb, a new all-time high was hit with 154,223 DCR in mixed volume, equivalent to over $3 Million. The fee for mixing is just a standard blockchain transaction fee for users, meaning each mix can be completed for a few cents.
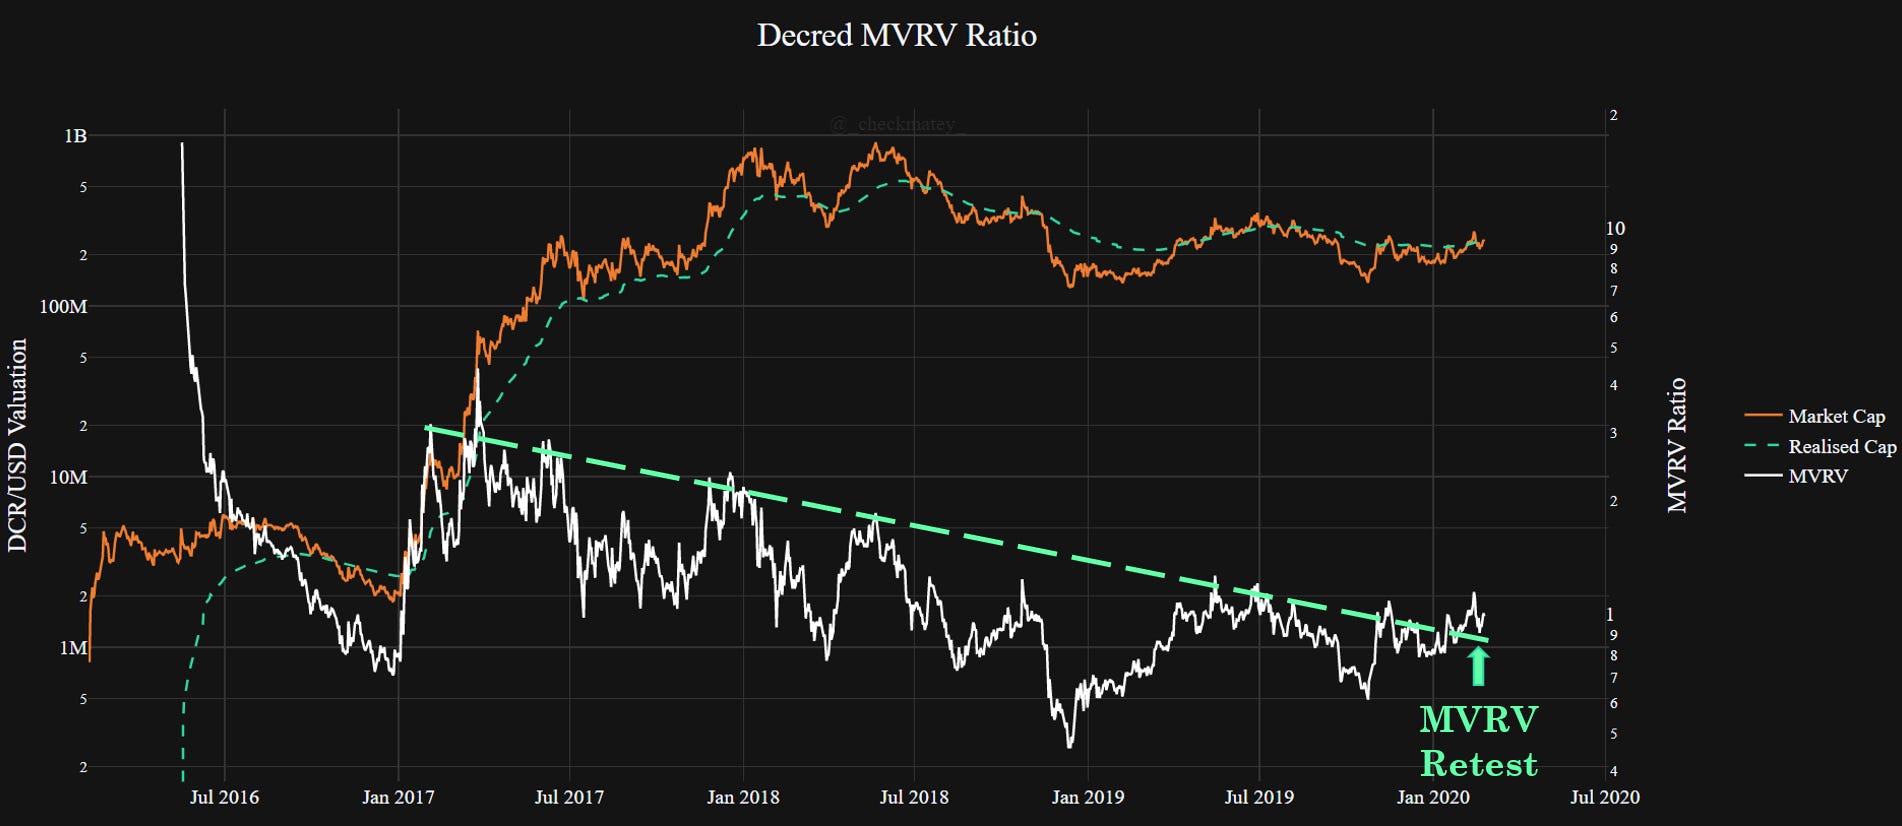
- The Decred MVRV Ratio shows the relationship (ratio) between the Market Cap and the Realised Cap. Since DCR is always moving on-chain in tickets, the Realised Cap tends to act as support in Bullish markets and resistance in Bear markets. Note, the Realised Cap is a sum of all UTXOs priced at the time they were last spent. The DCR Market Cap has recently broken above the Realised Cap and the MVRV Ratio is retesting support on the trend-line which has contained it since mid 2017. The author expects the MVRV to act as an oscillator in response to Bull/Bear cycles.
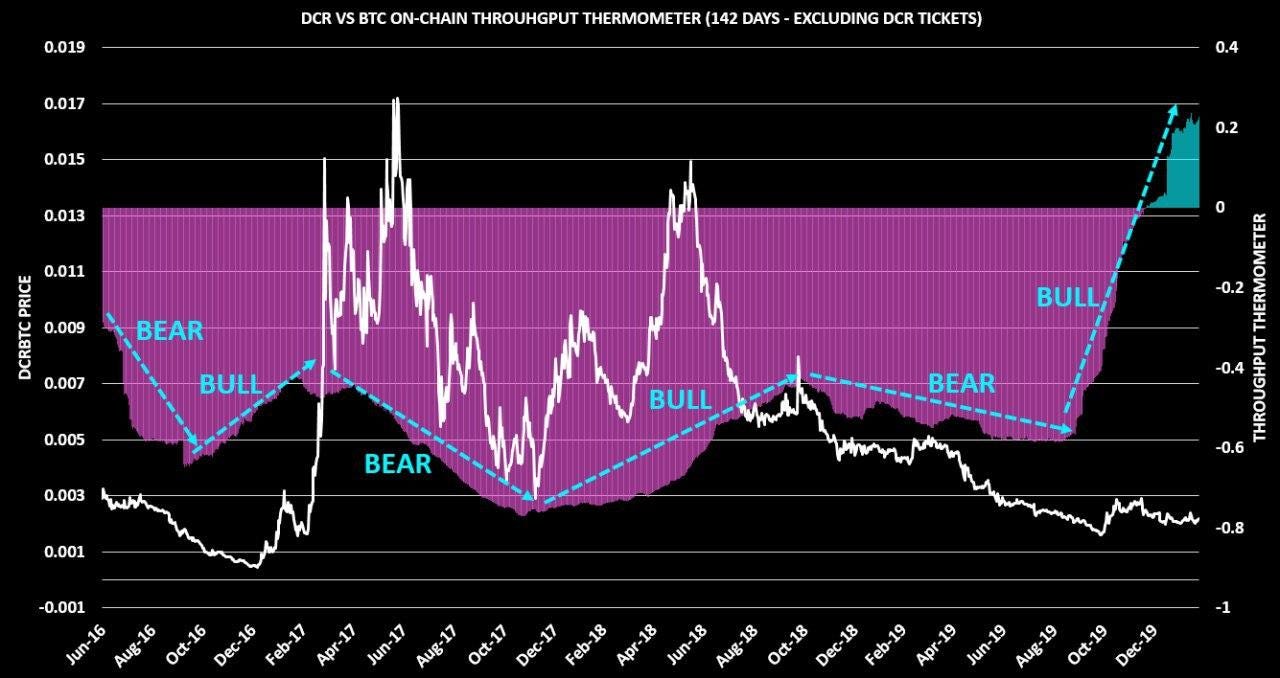
- The Throughput Thermometer compares on-chain throughput between two assets (DCR and BTC in this case) and adjusts for outstanding supply to ensure an apples-to-apples comparison. This tool is best used to gauge macro bullishness or bearishness. When the thermometer is trending upwards, Decred on-chain flows are increasing versus Bitcoin flows pound-for-pound, which generally is paired with an uptrend DCR/BTC price (and vice-versa). The chart below shows that over the past 142 days, Decred has settled 20% more native units on-chain relative to Bitcoin when adjusted for supply - an all time high for the Decred network. Note, this data excludes ticket transactions and is specifically representing non-ticket DCR transactions relative to all BTC transactions.
Contributor: Maksim Balashevich, founder of Santiment
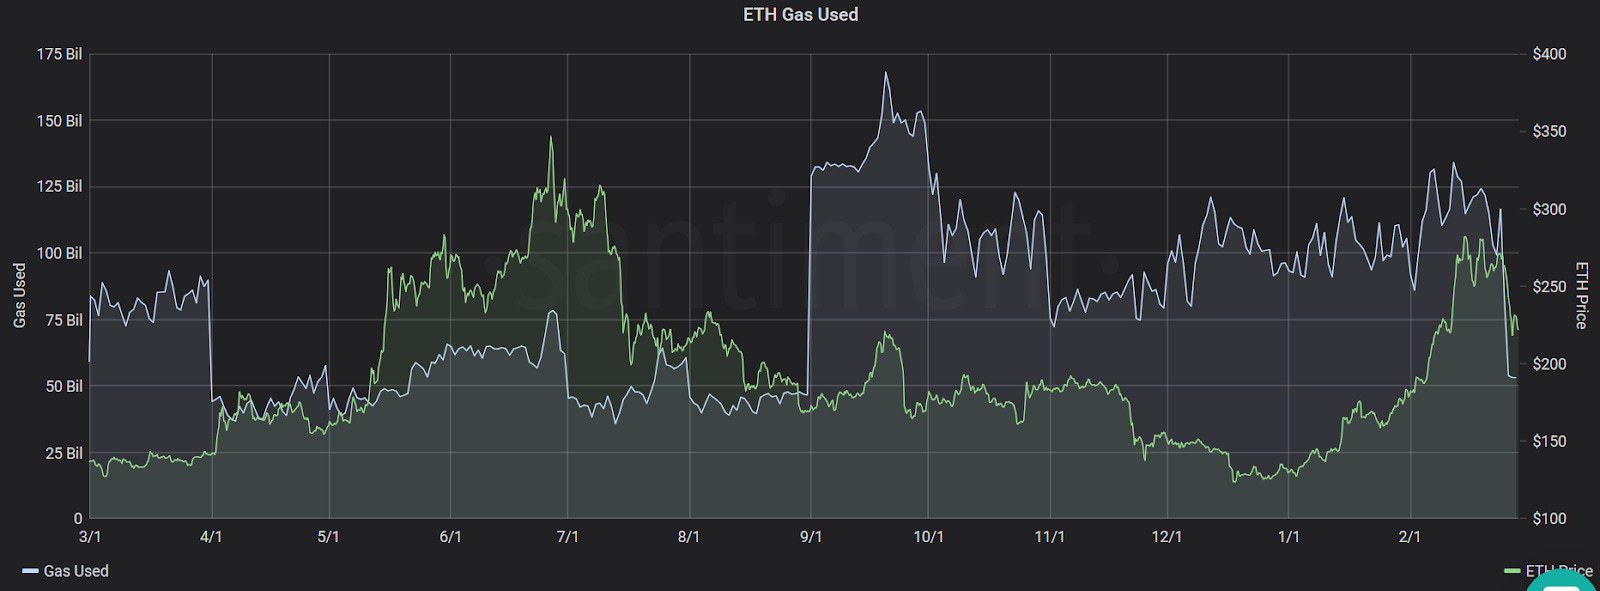
The total amount of Gas used on the Ethereum blockchain has dipped suddenly and significantly following the recent drop below $270 on February 24th. The cumulative fees required to successfully conduct a transaction or execute a contract on Ethereum are currently circulating at levels close to a 6-month low. About 46.6B ETH gas was used on August 31st, 2019 before jumping up to 128.9B gas on September 1st and remaining in this range for the next 5 months.
As of the past three days, the average daily gas used was 53.5B, while the average of the previous three days was $99.17B. If this trend continues for the remainder of the week, we will officially be at a 6-month low in terms of daily Gas usage. At first glance, it appears like gas usage on Ethereum might be consolidating as well, as the market crash makes network participants more averse to high-costs.
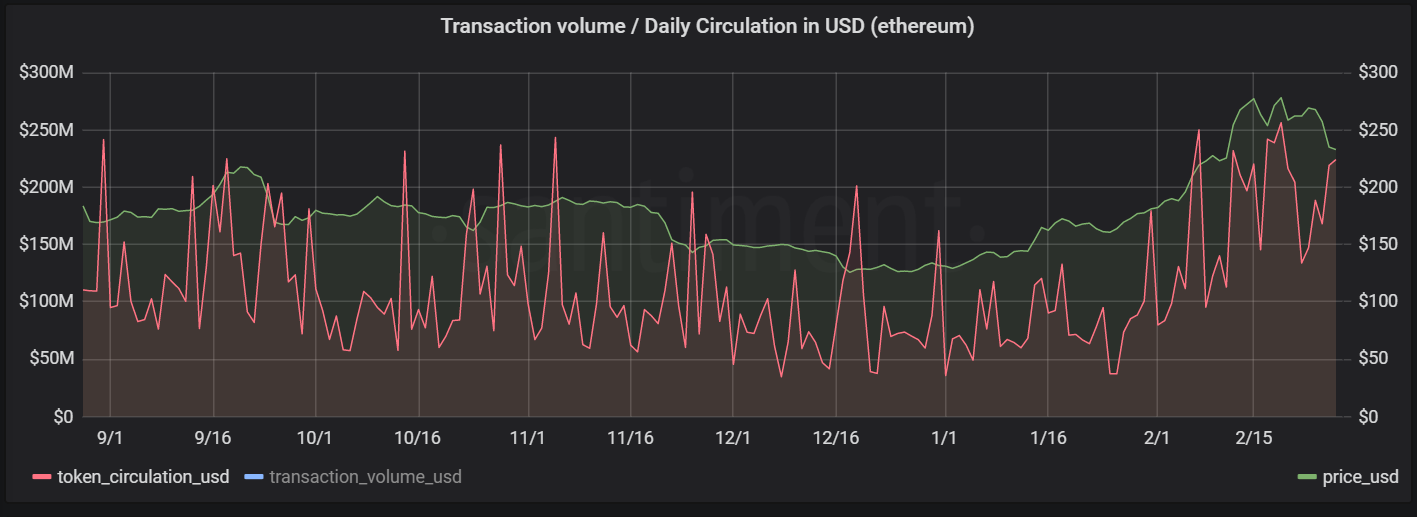
Amount of unique ETH transferred on the network improves in February. Ethereum’s token circulation, or the amount of unique ETH coins involved in transactions over the last month indicates an uptick in total value transferred on the network compared to the start of the year.
In USD, the total amount of transactions that took place on Ethereum in January carried a cumulative value of ~$3.39B. At the time of this writing, through February 26th, $2.85B of transactions have occurred for a projected 31-day rate (to provide an equal comparison to January) of $3.43B.
The difference in token circulation in February vs. January is a modest 1.2% increase but should serve as a confidence booster to those expecting network activity growth, as it shows unique coins continuing to move between addresses to maintain the mid-term trend of Ethereum’s growing market cap since the beginning of 2020. In spite of last week’s minor retracement, token circulation is maintaining its pace up near 6-month high levels.
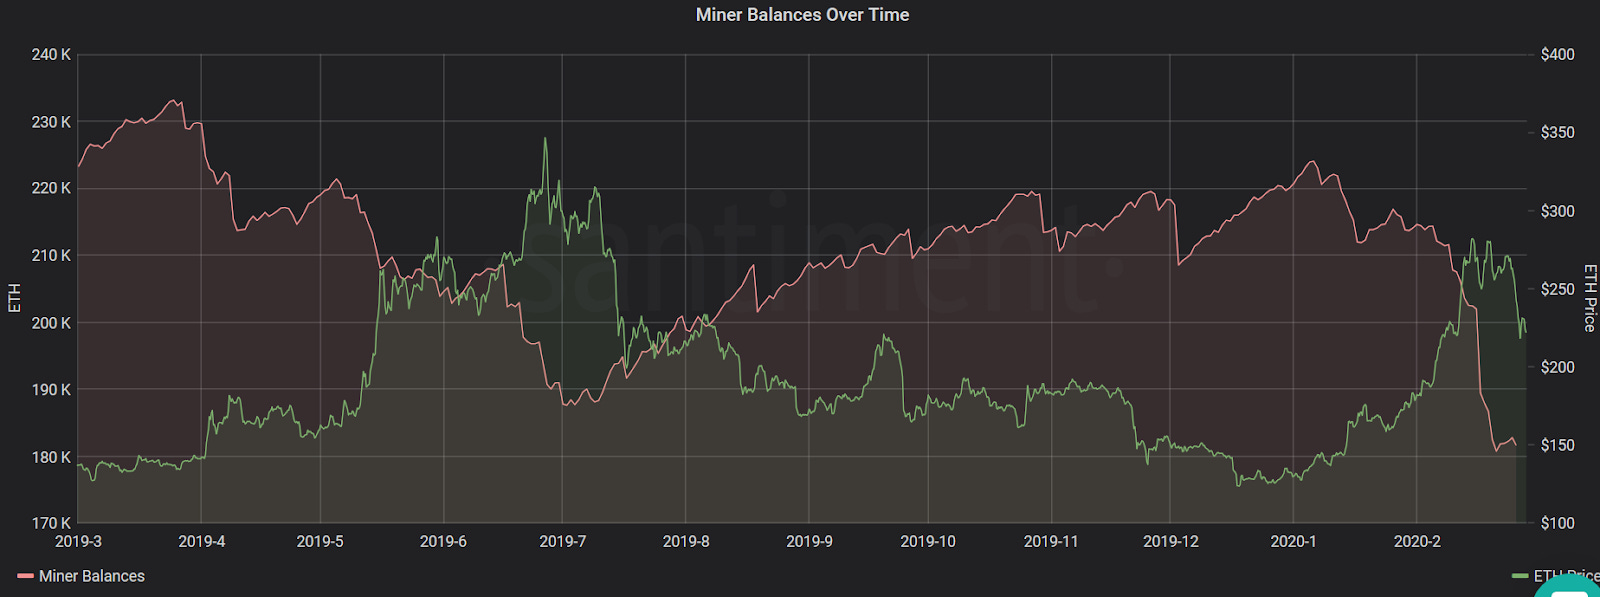
In our previous entry, we pointed to an ongoing accumulation trend among Ethereum miners, as their cumulative balance was poised to breach a 6-month high. Since then, we’ve seen a growing lack of confidence materialize on our Ethereum miner charts, with a notable decline in the total amount of ETH located in (known) miners wallets.
Since February 9th, ETH miners have offloaded more than 30,000 ETH, seemingly in unison with Ethereum’s short-term market conditions and its ongoing correction. At present, Ethereum miners are sitting on a 15-month low 181.6k ETH - levels that were last seen around late October, 2018.
We have also observed a similar trend around Ethereum’s 2019 price top - as market conditions improved, the miners’ confidence in Ethereum’s short-term price action dwindled correspondingly, with almost 19k ETH dumped in a span of 2 weeks in July (as seen on the chart above).
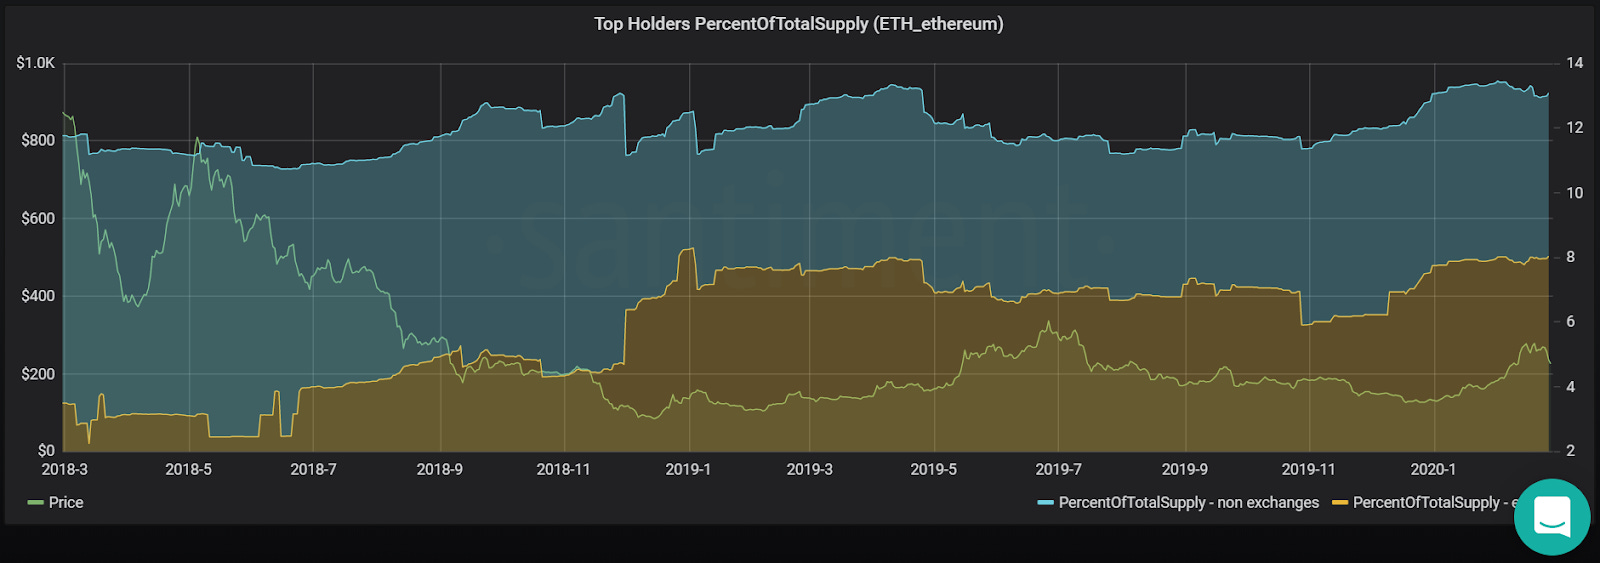
A great way to understand the “wealth gap” between top holders and the rest of the investors of Ethereum is to look at what percentage of ETH’s total supply is presently concentrated in 10 of its biggest addresses. On Sandata, we’re noticing that the network’s biggest ‘whales’ are still on the cusp of a 2-year high in terms of their share of Ethereum’s total supply, currently holding 13.15% of all ETH tokens.
The 2-year low, for contrast, was 11.16% in December, 2018, which is considerably lower when factoring in the value of 2% of all ETH tokens. For perspective, the USD value of 2% of today’s circulating supply of 109.88M ETH is approximately $497.59M. Particularly, the percent of ETH’s total supply held in the biggest exchange wallets continues to creep up at 8.11% - very close to its peak around January 3, 2019, as ETH’s price was close to bottoming out.
Contributor: Alexander Eichhorn, Founder at Blockwatch Data
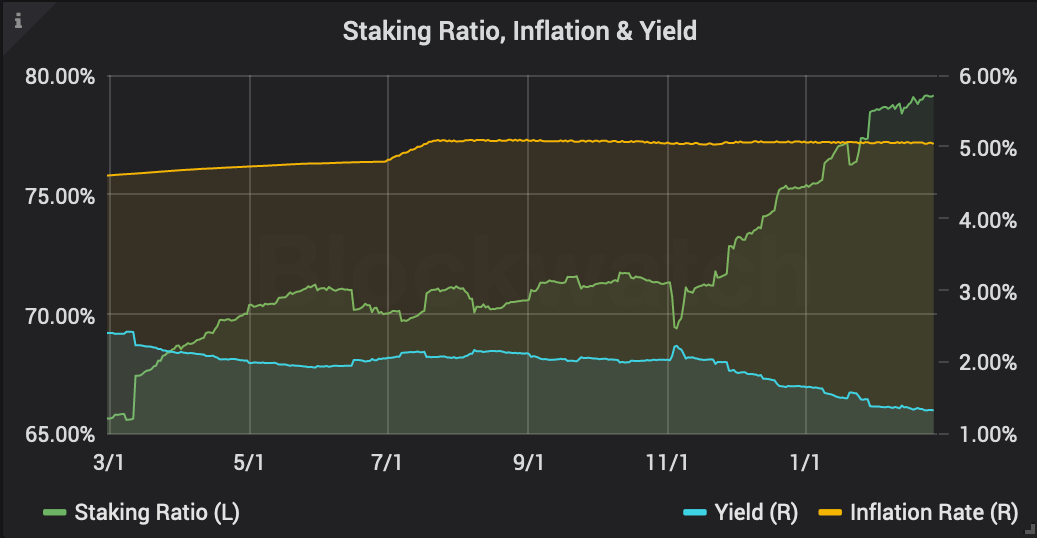
- Staking: Custodial staking on centralized exchanges continues to grow massively. Now, at the end of Feb 2020, 126.8M tez (19.4% of all staked coins, 15% of total supply) are held by custodians, up +27% (30.6M) from January. Network-wide staking is still on the rise with +3.2% (20M) to reach a new ATH of 79.14% (655M). In perspective, only 2.9M new tez were minted last month. Staking rewards are at 6.48% annually, yield above inflation dropped to 1.44%.
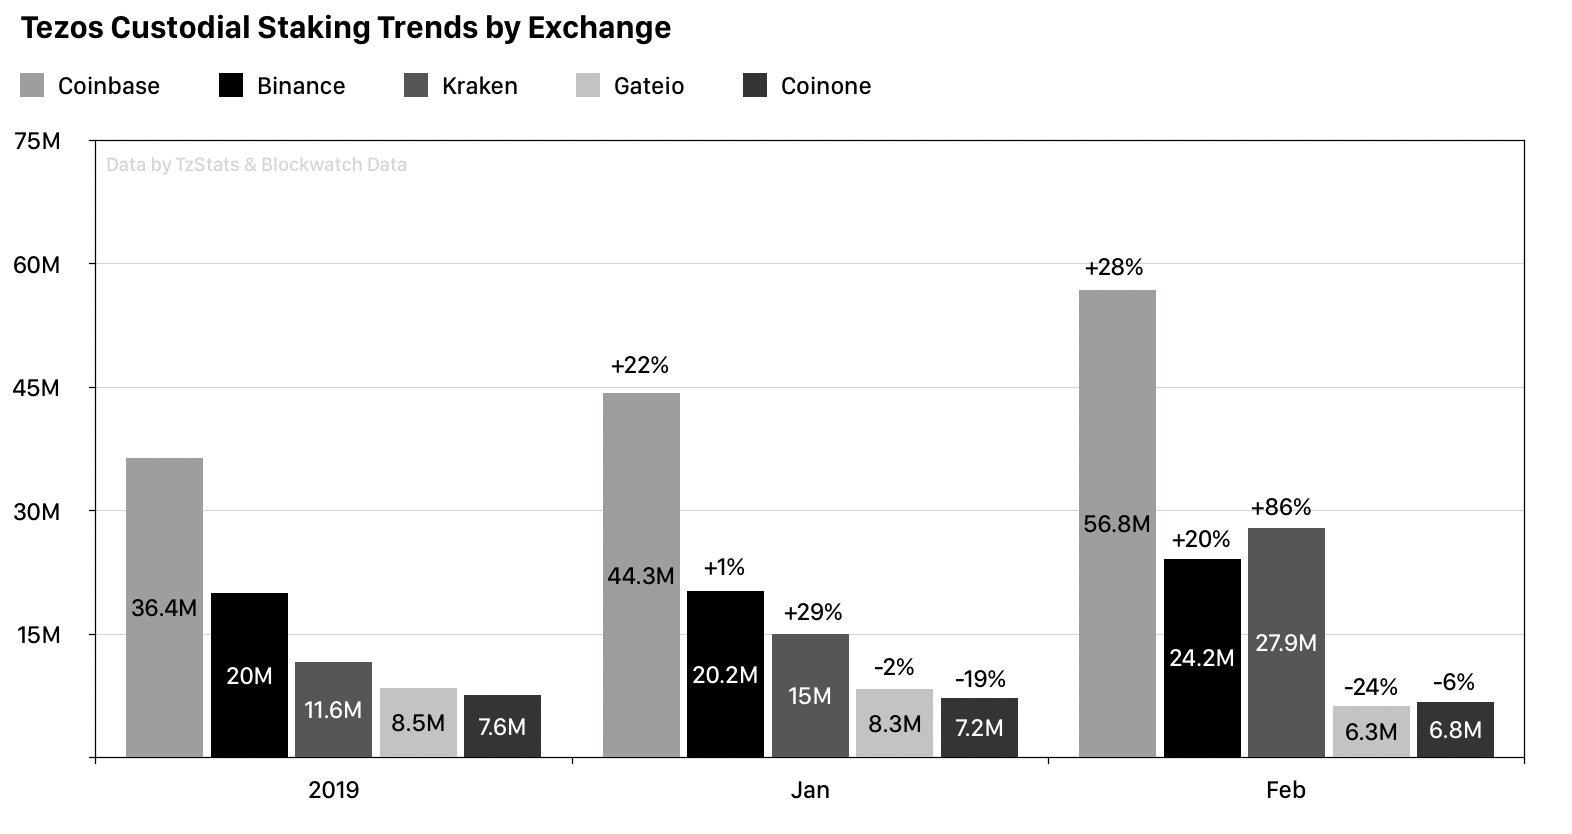
- Custodians: Growth of custodial staking services is impressive. With 8.4% of the network stake, Coinbase has become the largest staking provider in Tezos within the past 4 months, directly followed by Kraken with 4.2%. Only the Tezos Foundation manages more stake (26.7%). Smaller custodians are on decline, although Chinese exchanges OKEx and Huobi grow as well. Zero-fee staking at Binance shows impact on traditional bakers who either shut down like Airfoil or begin offering zero-fee promotions. However, custodial growth is slowing down. After all there are only 128M (15%) more tez unstaked, about the same amount that has been moved on-chain this month.
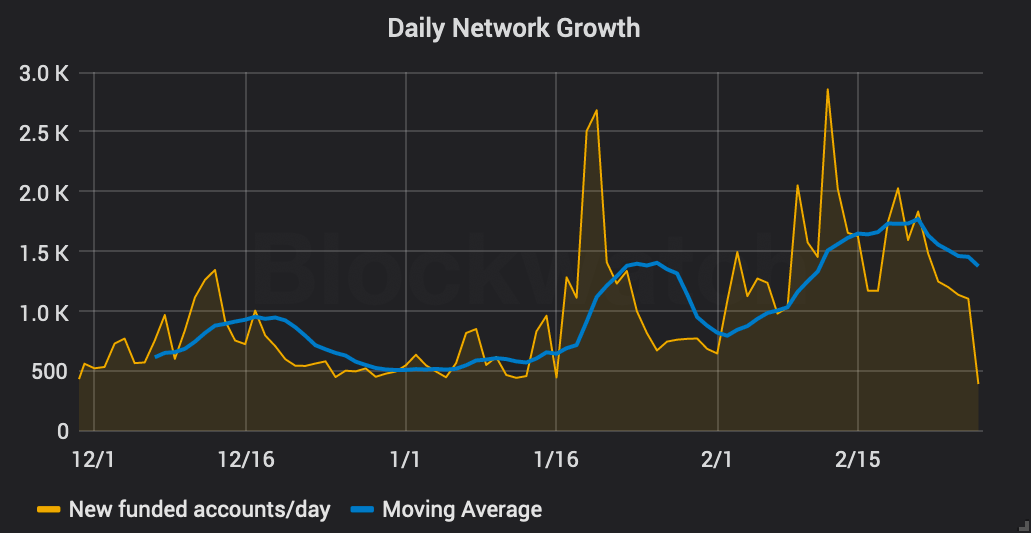
- Growth: Funded accounts increased by +10% (+37k) to 418k confirming that Tezos has entered a phase of exponential growth which started in Oct'19. Accounts with a balance > 100 tez grew +9.8% to 27k, accounts between 10 and 100 tez even by +29% to 10.5k. Still, the top 1k accounts hold 63% of total supply and Gini index for balances > 1 tez is at its ATH of 0.96.
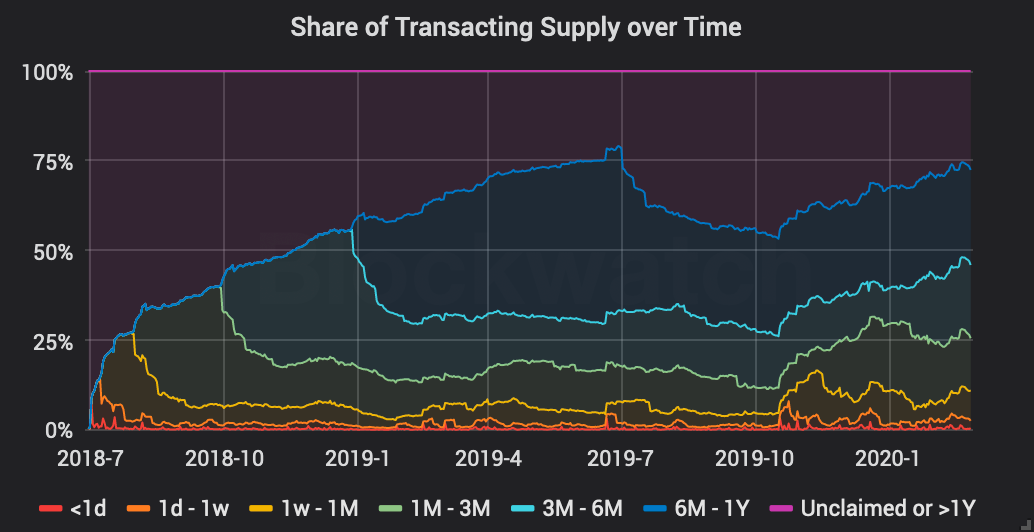
- Hodl Waves: We analyzed transaction flows between accounts to understand how many tez moved on-chain historically. Although Tezos' accounting model differs from UTXO chains we can still measure how much was on the move, just not which coins exactly. 613M tez were minted on genesis, but activation was required, so owners slowly claimed the majority within year 1. Today there are still 56M unclaimed tez and about 125M unvested tez owned by the Tezos Foundation. The first large-scale macroscopic shift in Tezos started in late 2019 after the Babylon network upgrade activated which allowed staking from any address type and when custodial staking started to rise. These events ended the Genesis hodl wave. To a much lesser extent a short 3-month hodl wave ended in early Feb'20 due to an ongoing price rally.
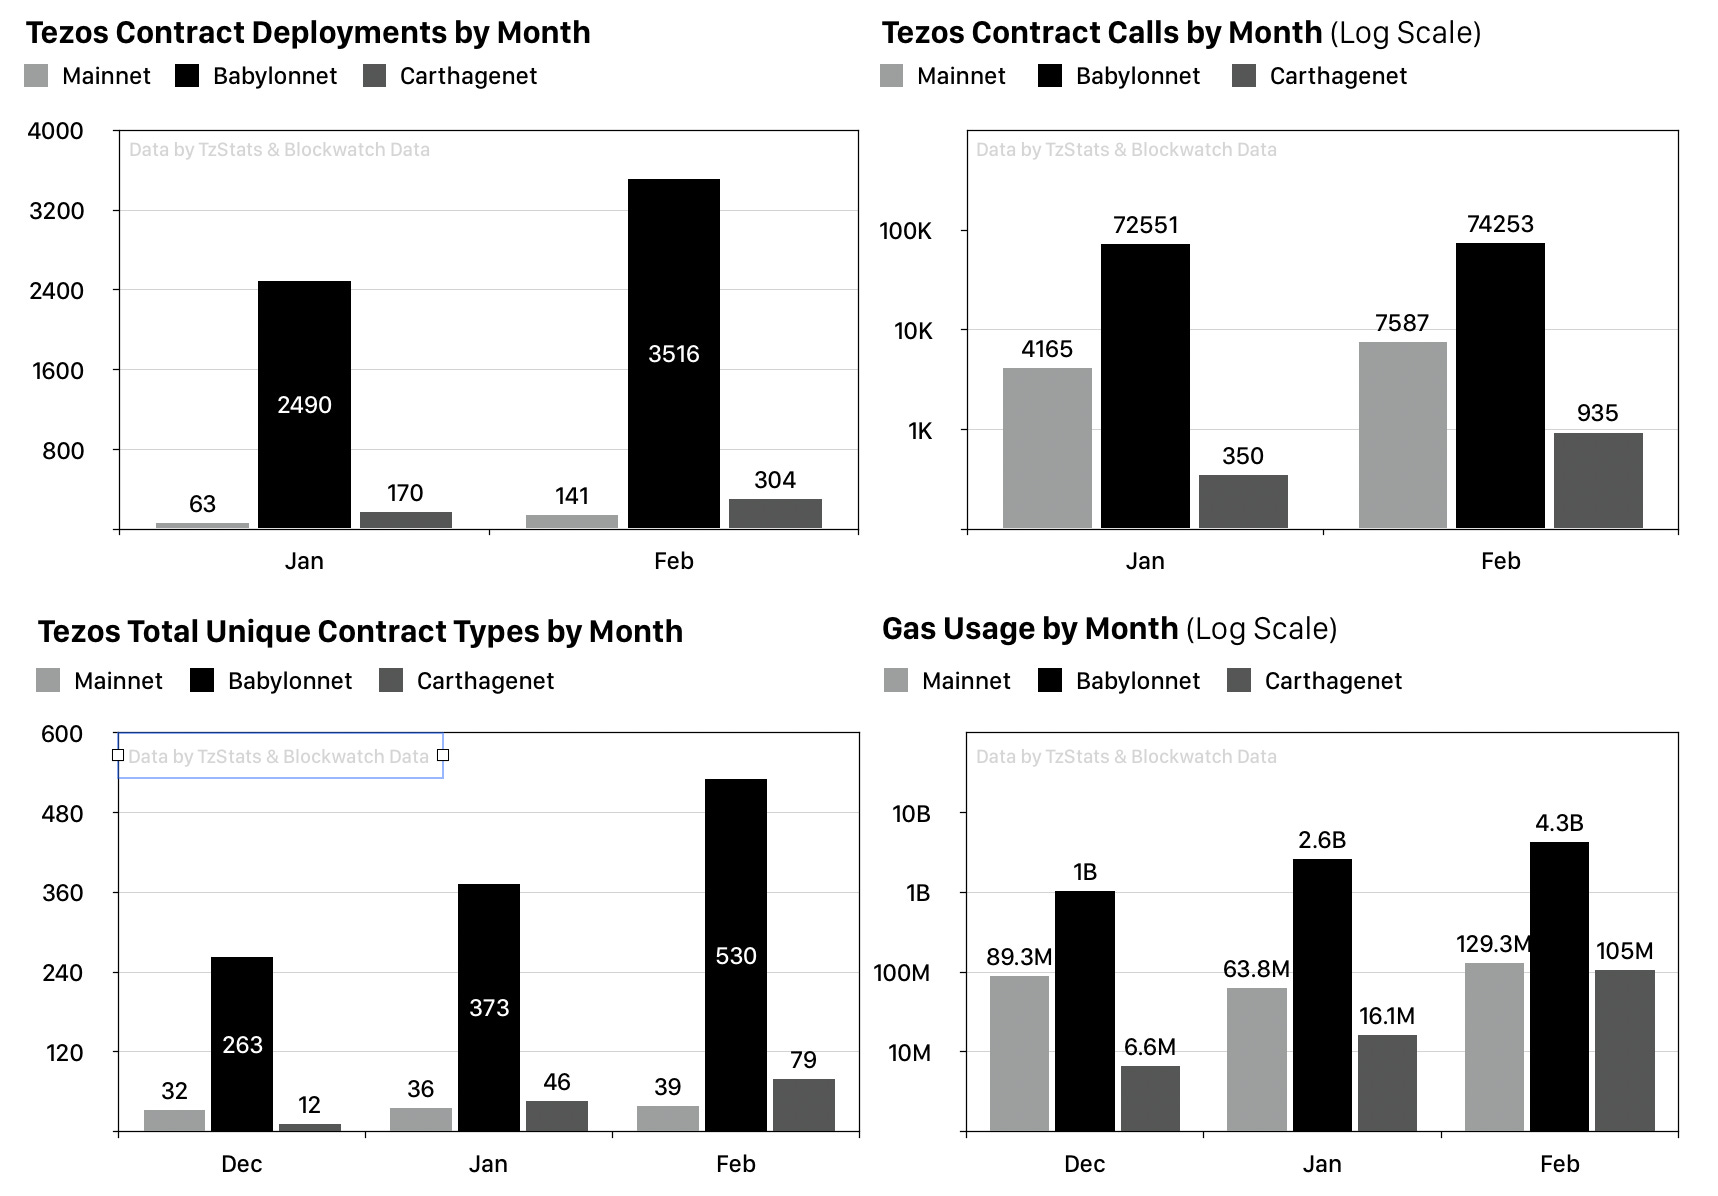
- Adoption: Testnets still outshine the smart contract situation on Tezos Mainnet. Calls on Mainnet have almost doubled compared to January (+7,587), the Atomex DEX saw some limited traffic (33 swaps) and early experiments with FA1.2 tokens have started. Babylonnet remains the most active network with a new record of +3,516 contracts and +74k calls this month, but note that these are all test contracts, often deployed and called by automated CI systems. The diversity of unique contract types (identified by their call interfaces) grew by +157 to 530 in total. 8 out of the top 10 contract types are generic programming examples. The most prominent contract people work on is DS Token (used by Securitize and Elevated Returns) with 111 total deployments and 6,652 calls in Feburary.
Our Network is a weekly newsletter where top blockchain projects and their communities share data-driven insights. Subscribe now to receive a crash course in on-chain metrics and crypto fundamentals, and never miss an issue.
About the editor: Spencer Noon leads investments for DTC Capital, a fundamentals-focused crypto fund. He actively tweets about on-chain metrics.