ON–016: DeFi
Apr 10, 2020

Reminder: Gitcoin Grants donations close at 12pm EST today! Click here to support our mission — thank you!Welcome to Issue #16 of Our Network, a weekly newsletter where top blockchain projects and communities share data-driven insights and advanced metrics. This week our contributors dive in and explore crypto exchanges:
- 0x
- Uniswap
- Exchanges (High Level)
- Kyber Network
- dYdX
Contributor: Alex Kroeger, Data Scientist at 0x
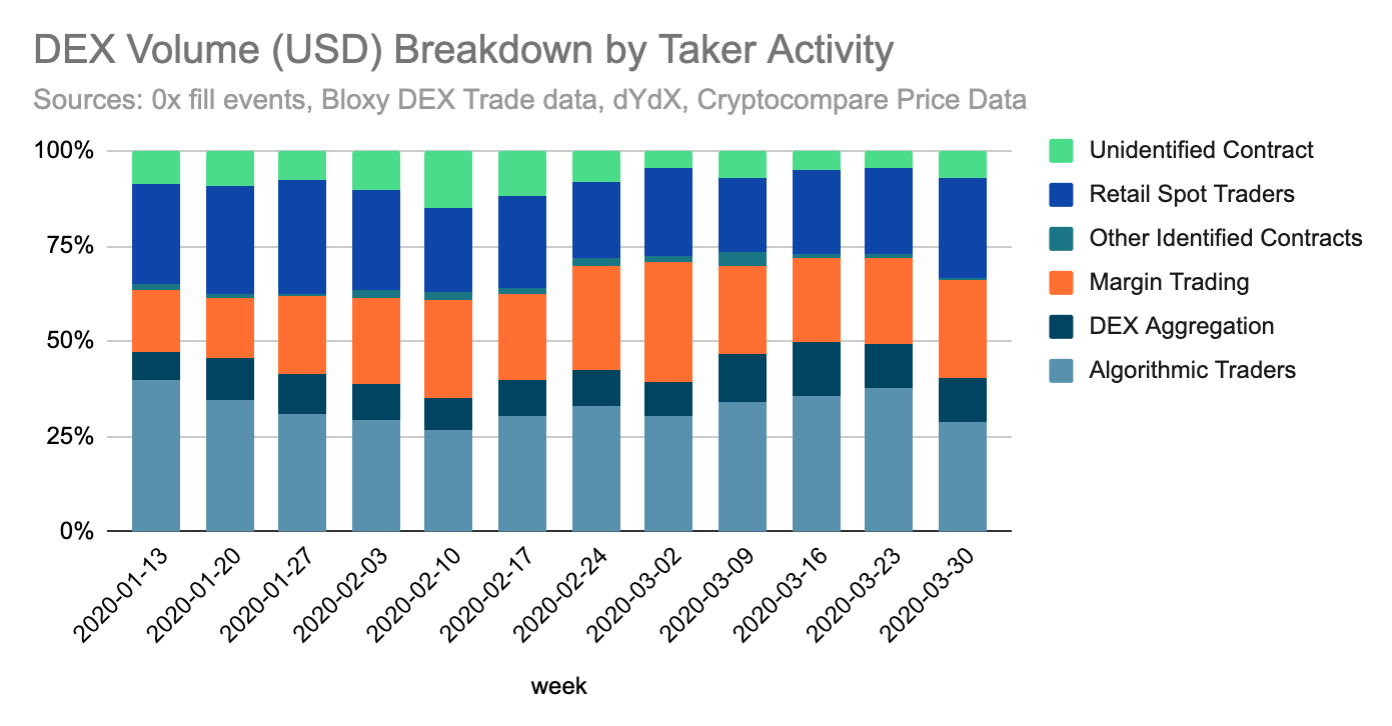
Previously on Our Network we’ve examined slippage on 0x. This is the liquidity provision or maker side of DEX’s. Equally important is examining the demand for liquidity, or the taker side of DEXs. In my research, I have identified and quantified 4 primary use cases of DEX liquidity.
“Retail” spot trading. This is volume whereby normal (non-contract) Ethereum accounts trade one token for another. Examples include KyberSwap, Uniswap, and Tokenlon. Here I exclude addresses whose trade frequency indicates bot-like behavior. I estimate that this use case accounted for 26% of DEX volume in the most recent week.
Margin trading. This is trading that incorporates borrowing to amplify rewards. Margin trading is dominated by dYdX currently, but also includes other dApps like Nuo. Margin Trading accounted for another 26% of volume in the most recent week.
DEX Aggregation. DEX aggregation entered the scene last year as a way to utilize liquidity from multiple protocols within a single trade in order to get a better price than from any single protocol. Examples include 1inch Exchange, DEX.AG, and the 0x API /swap/quote endpoint. Last week DEX aggregation accounted for ~11% of DEX trading volume.
Algorithmic trading. Algorithmic traders interact with DEX protocols programmatically for profit. Specific trading behavior includes arbitraging across DEX protocols within a single transaction, handling lending protocol liquidations, and arbitraging between DEXs and centralized exchanges. Here, I identify algorithmic traders by identifying contracts that profit from DEX pricing differentials as well as normal (non-contract) addresses with high trade frequency. Algorithmic traders made up ~29% of DEX volume.
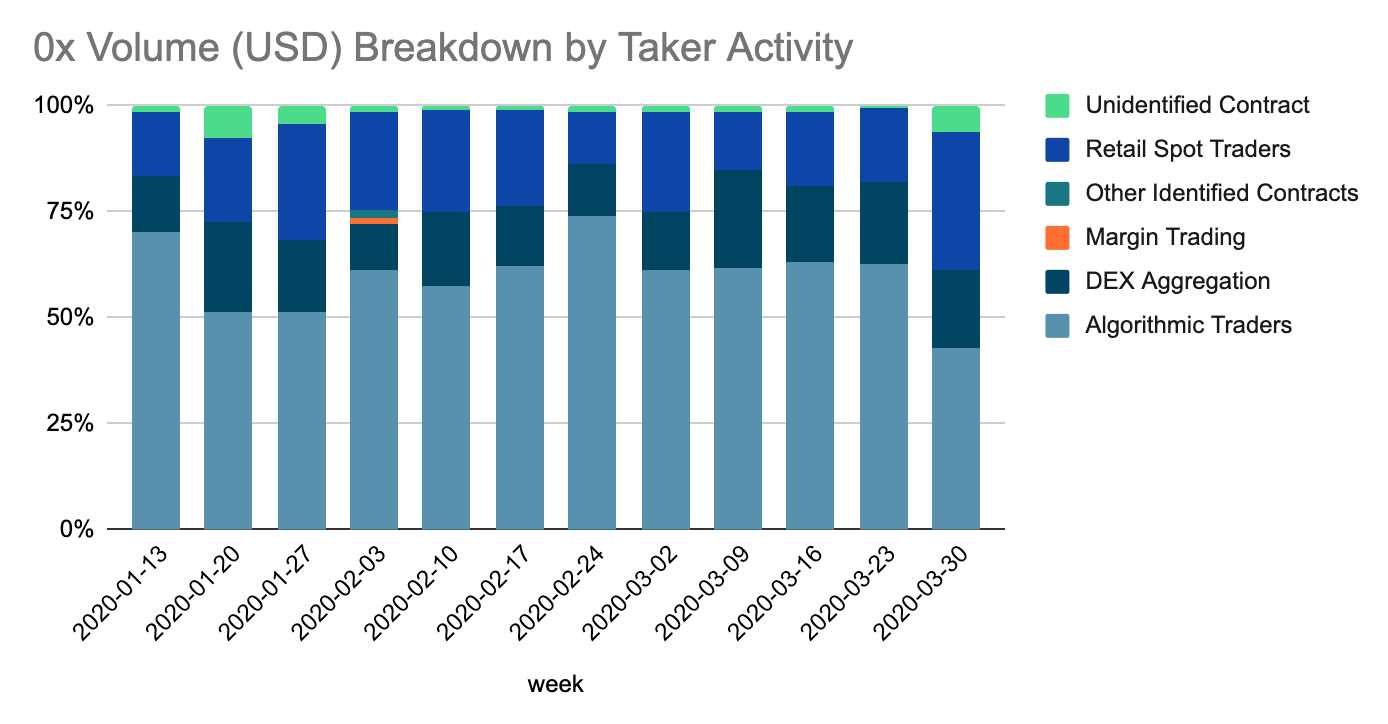
- How does demand for liquidity on 0x compare to the overall DEX distribution? 0x volume is much less heavily indexed on margin trading currently. Retail trading is supported by Tokenlon, and algorithmic traders consume a great deal of liquidity via 0x mesh as well as on Tokenlon. Most of the remainder is consumed by DEX aggregators including the 0x API /swap/quote endpoint, 1inch Exchange, and DEX.AG.
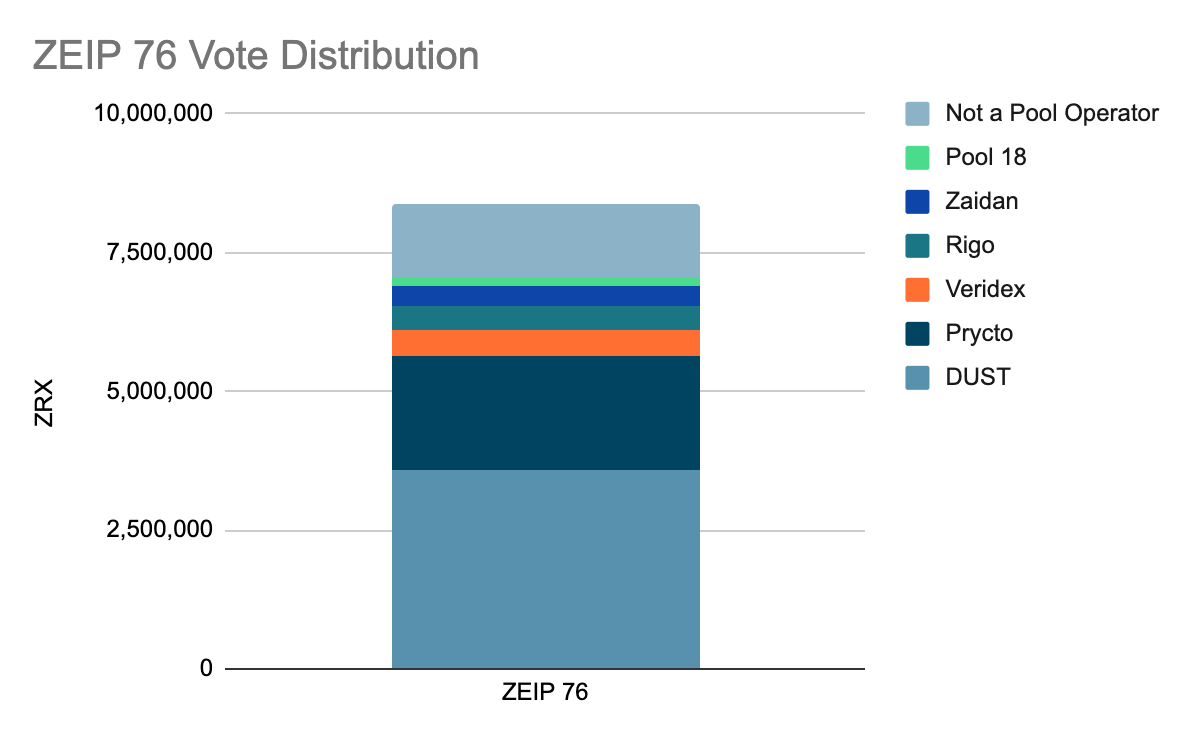
The 0x community just resolved its latest vote on April 5. The topic at issue was ZEIP 76, a meta-ZEIP for standardizing the ZEIP process itself. The issue was relatively uncontroversial, since it involved no changes to the protocol itself. It was, however, the first vote after the introduction of the new ZRX token economics in v3. In the new token economics, market makers that run staking pools are able to vote with half of the ZRX contributed by members of their pool, thus aligning governance with the interests of market makers. However, since half of the voting power remains with stakers, the stakers can collectively cancel out the vote of the operator should they choose to do so.
With 8.4M ZRX in voting power represented, the vote was the largest ZRX turnout for a vote yet, surpassing the vote for v3 of the protocol (which represented 6.6M ZRX). Most of the ZRX voting power represented belonged to staking pool operators.
Contributor: Caleb Sheridan, co-founder of Blocklytics
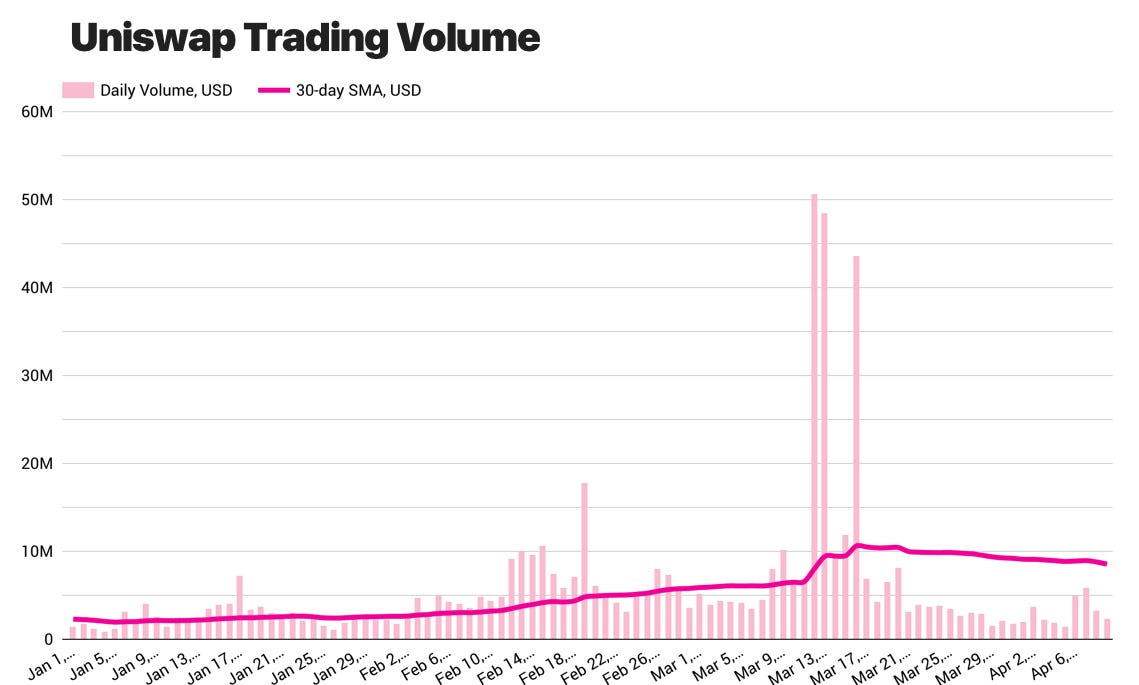
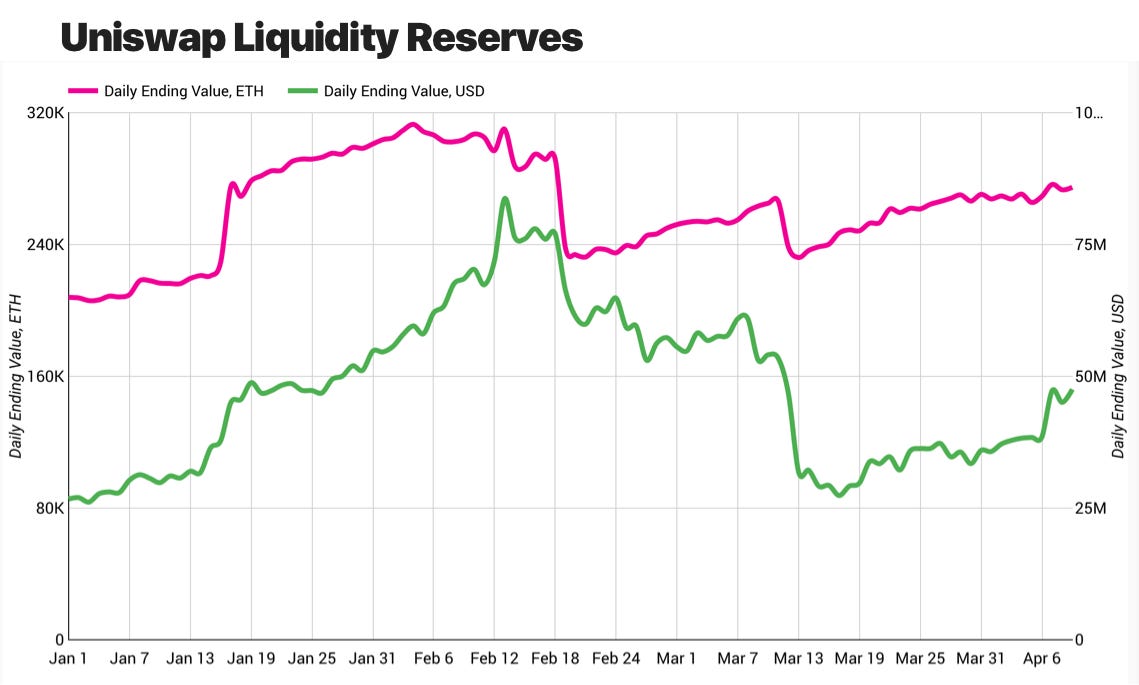
- Uniswap trading volumes spiked to all-time highs on Black Thursday. Volatility drives volume in automated-market making systems. Uniswap's 30-day average daily trading volumes briefly peaked over $10m.
- Uniswap liquidity is currently valued at 275K ETH. Liquidity providers deposit funds to earn trading fees. On the days where Uniswap collected the most fees, some LPs were removing their liquidity. Deposits (in ETH terms) are growing again and have returned to figures last seen in February.
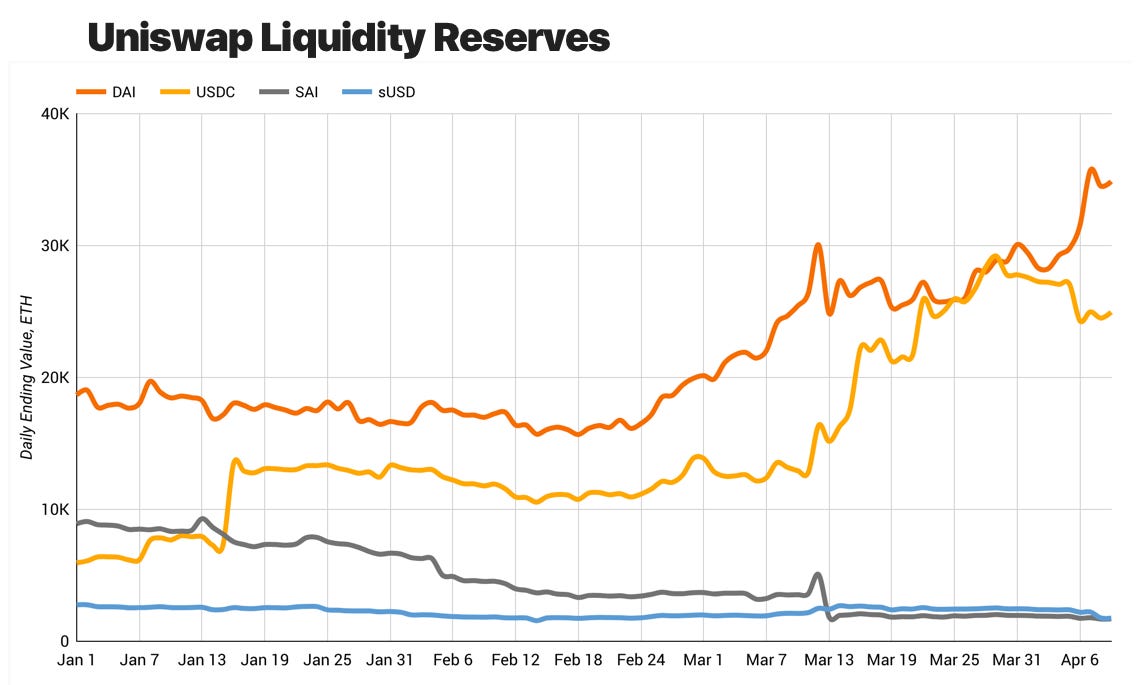
- Stablecoins are some of the most popular markets on Uniswap. DAI and USDC liquidity are growing quickly. SAI liquidity is declining as the Maker community considers initiating its shutdown.
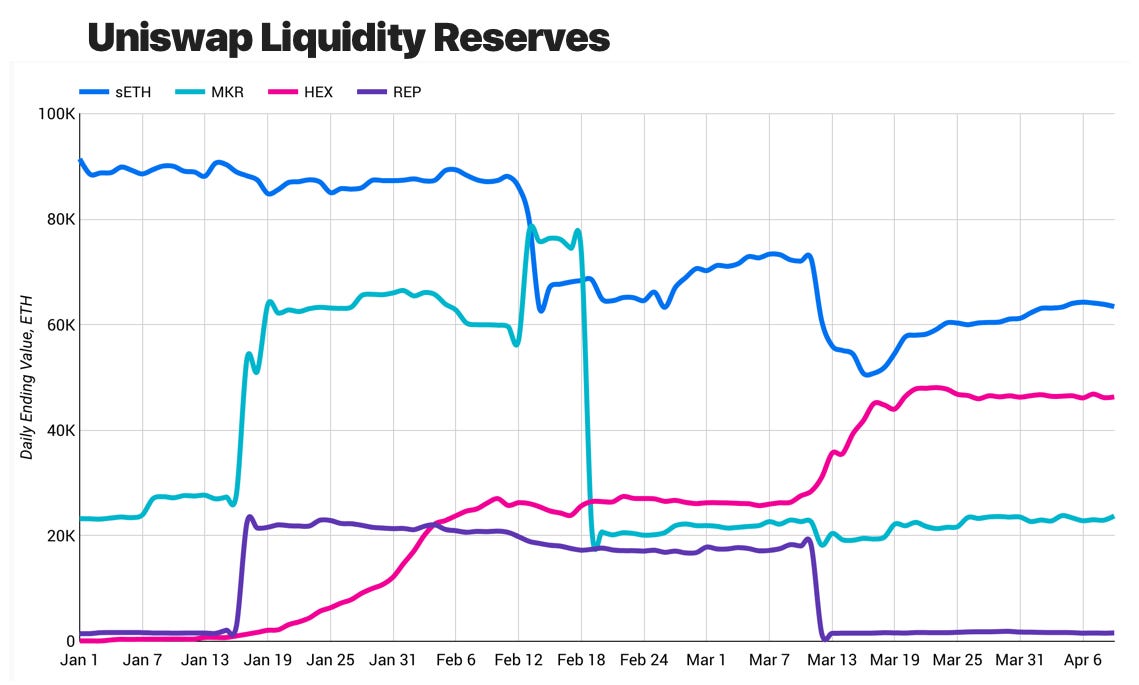
- Then there are other popular markets on Uniswap. HEX continues its inexplicable rise. Most REP liquidity was removed in one fell swoop. And the MKR liquidity which was removed in response to flash loan attack vectors never returned -- even after timelocks were implemented.
Contributor: Alex Svanevik, co-founder at D5
- March was a big month for stablecoins. Looking at net flow of Ethereum-based stablecoins for 2020 YTD, we see a clear trend of stablecoins flowing into exchanges:
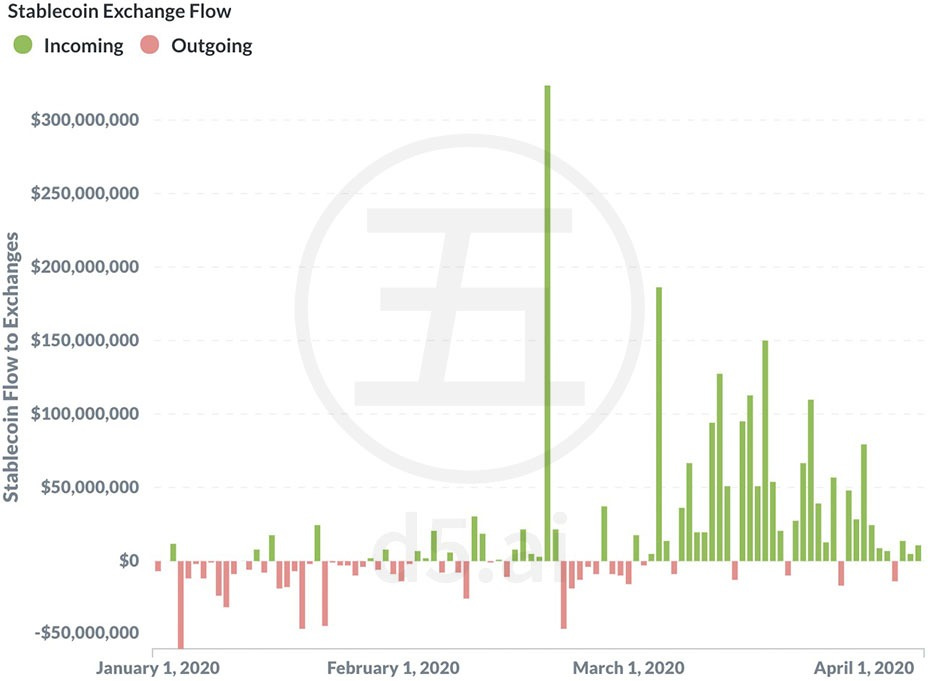
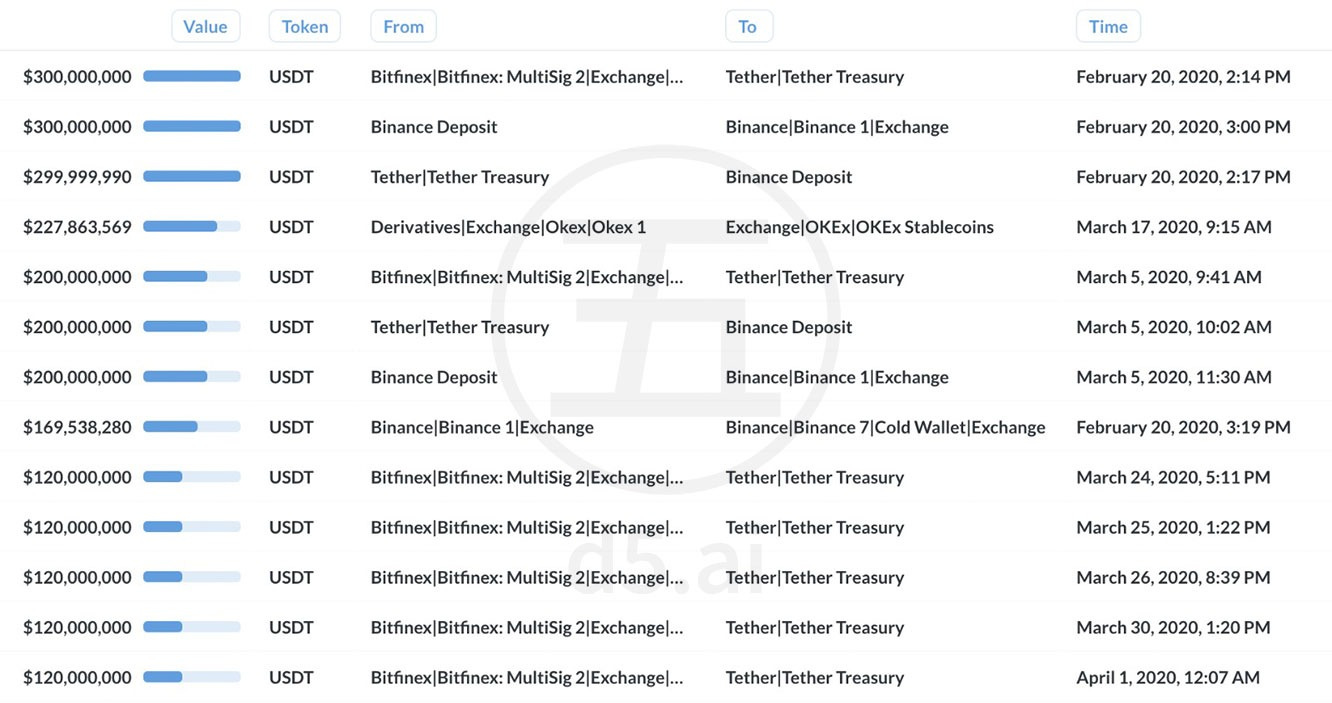
- Remarkably, every single weekday since March 3rd has had a net inflow of stablecoins to exchanges. The only days of net outflow have been Sundays and one Saturday (March 7th). One explanation may be that institutional traders are likely to be more active on weekdays. The massive spike on Feb 20 was according to Tether due to a $300M USDT chain swap from Tron to Ethereum, which ended up on Binance.
In one hour Tether will coordinate with a 3rd party to perform a chain swap (conversion from Tron to ERC20 protocol) for 300M USDt.
— Tether (@Tether_to) 12:14 PM ∙ Feb 20, 2020
Tether total supply will not change during this process.
- Speaking of Binance - this is where most of the stablecoin action is happening. An incredible net inflow has resulted in a combined stablecoin balance of more than $1.2B for Binance, making it the largest stablecoin holder:
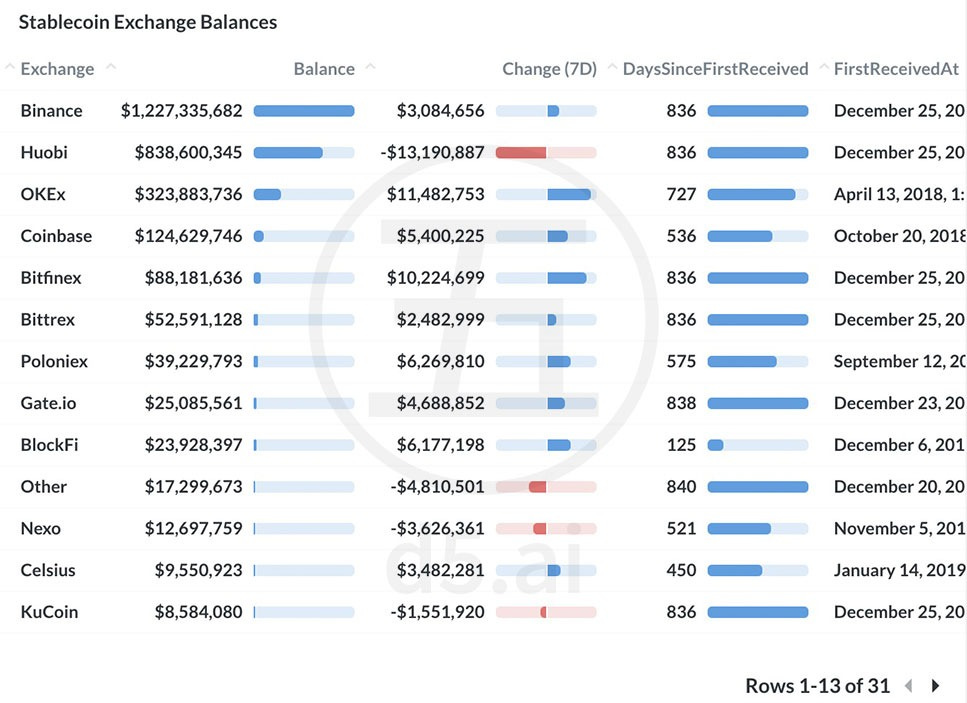
- Drilling down to the transactional level of all large stablecoins so far this year, we can see that: (1) the largest stablecoin transactions were all USDT, and (2) all were exchange-related:
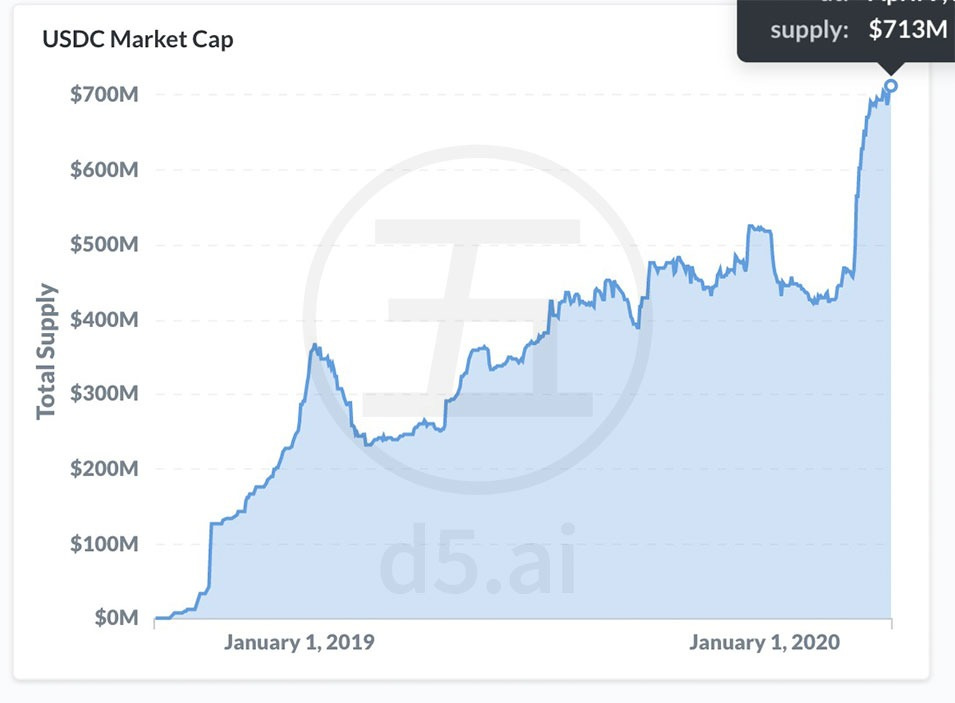
- But USDT is not the only stablecoin in town! USDC in particular significantly increased their market cap in March, from ~$450M to $700M. All of these signals show that stablecoins are increasing their importance in the crypto markets, just as the US Dollar is showing its dominance in financial markets more broadly.
Contributor: Deniz Omer, Head of Ecosystem Growth at Kyber
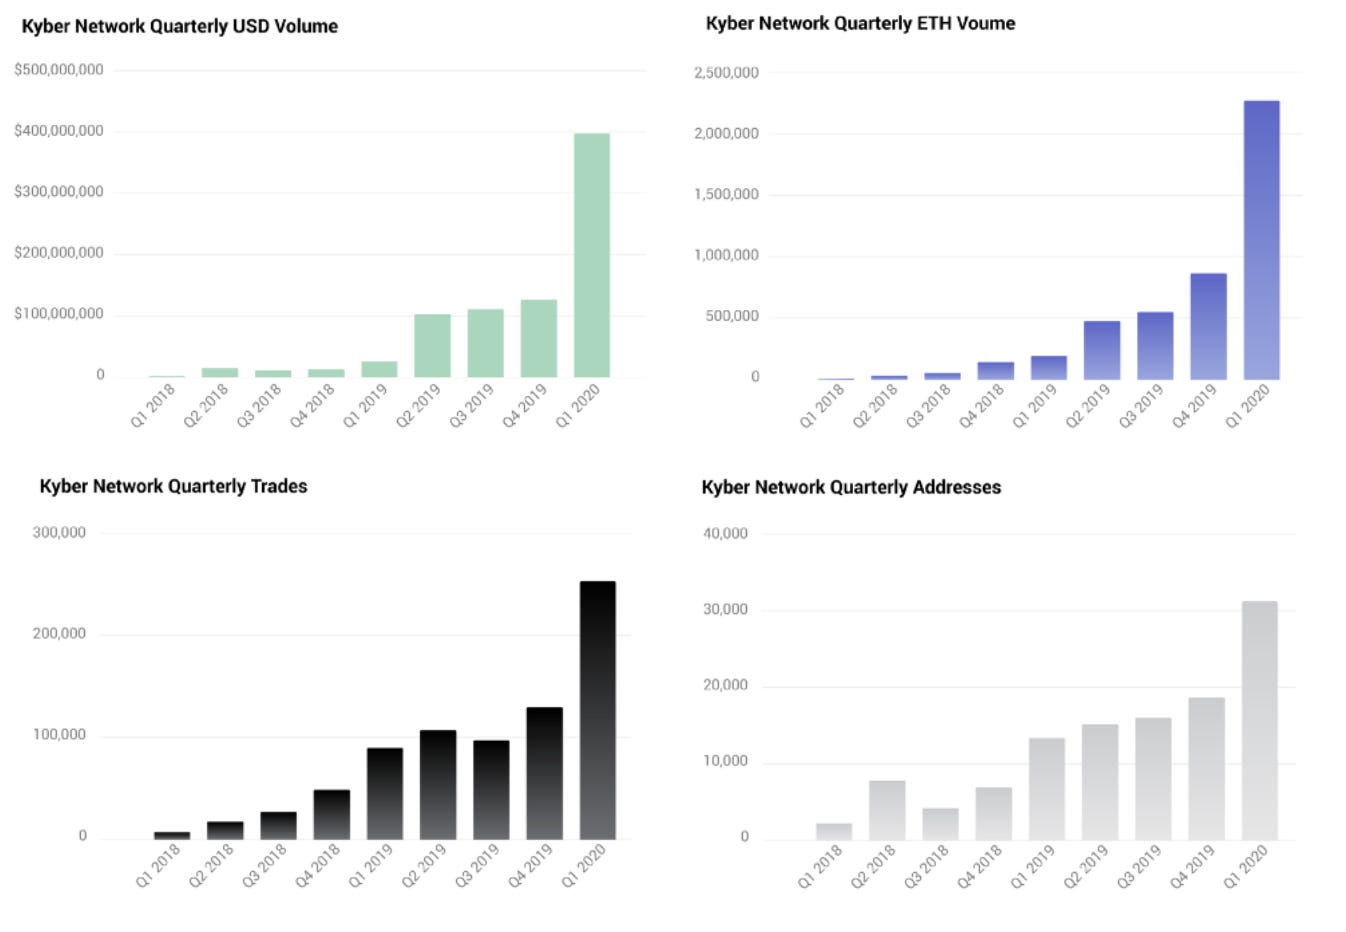
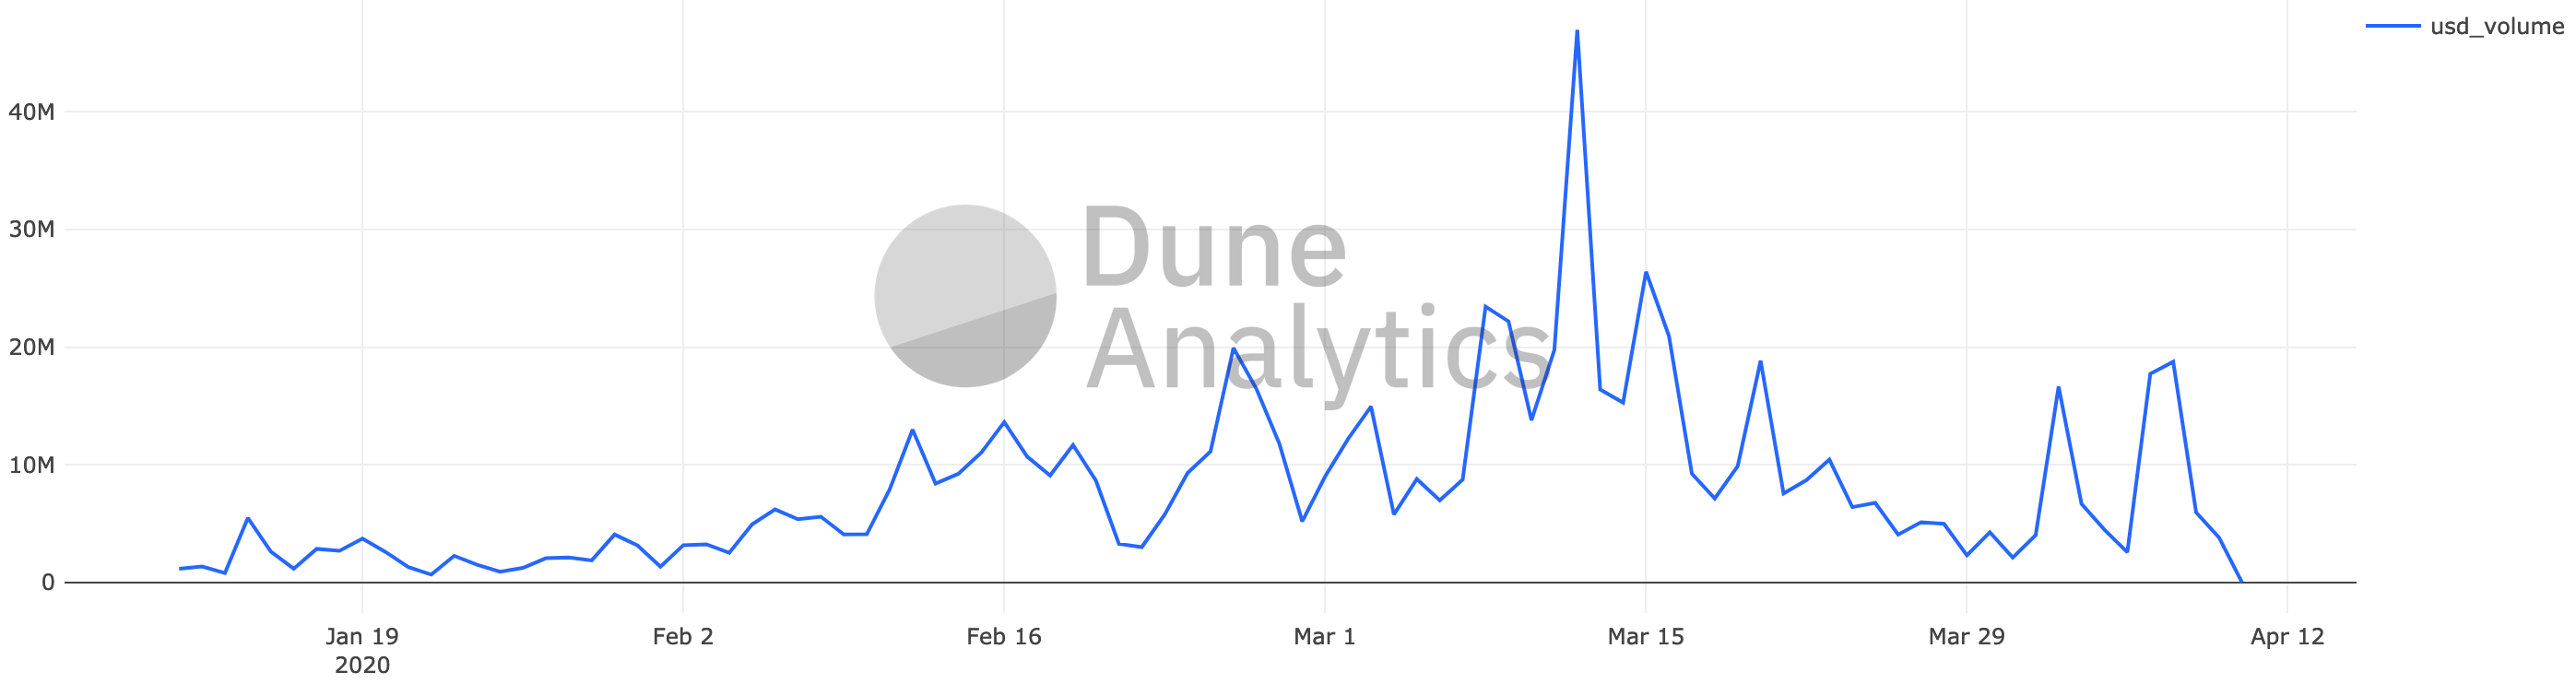
- Kyber Network total trades, unique addresses, and USD and ETH volumes have been showing strong quarter-on-quarter growth since launch and the recent volatility of both a micro-bull market followed by a bear market within the span of a few months has led to a standout Q1 for Kyber with volumes tripling and users doubling since the beginning of the year.
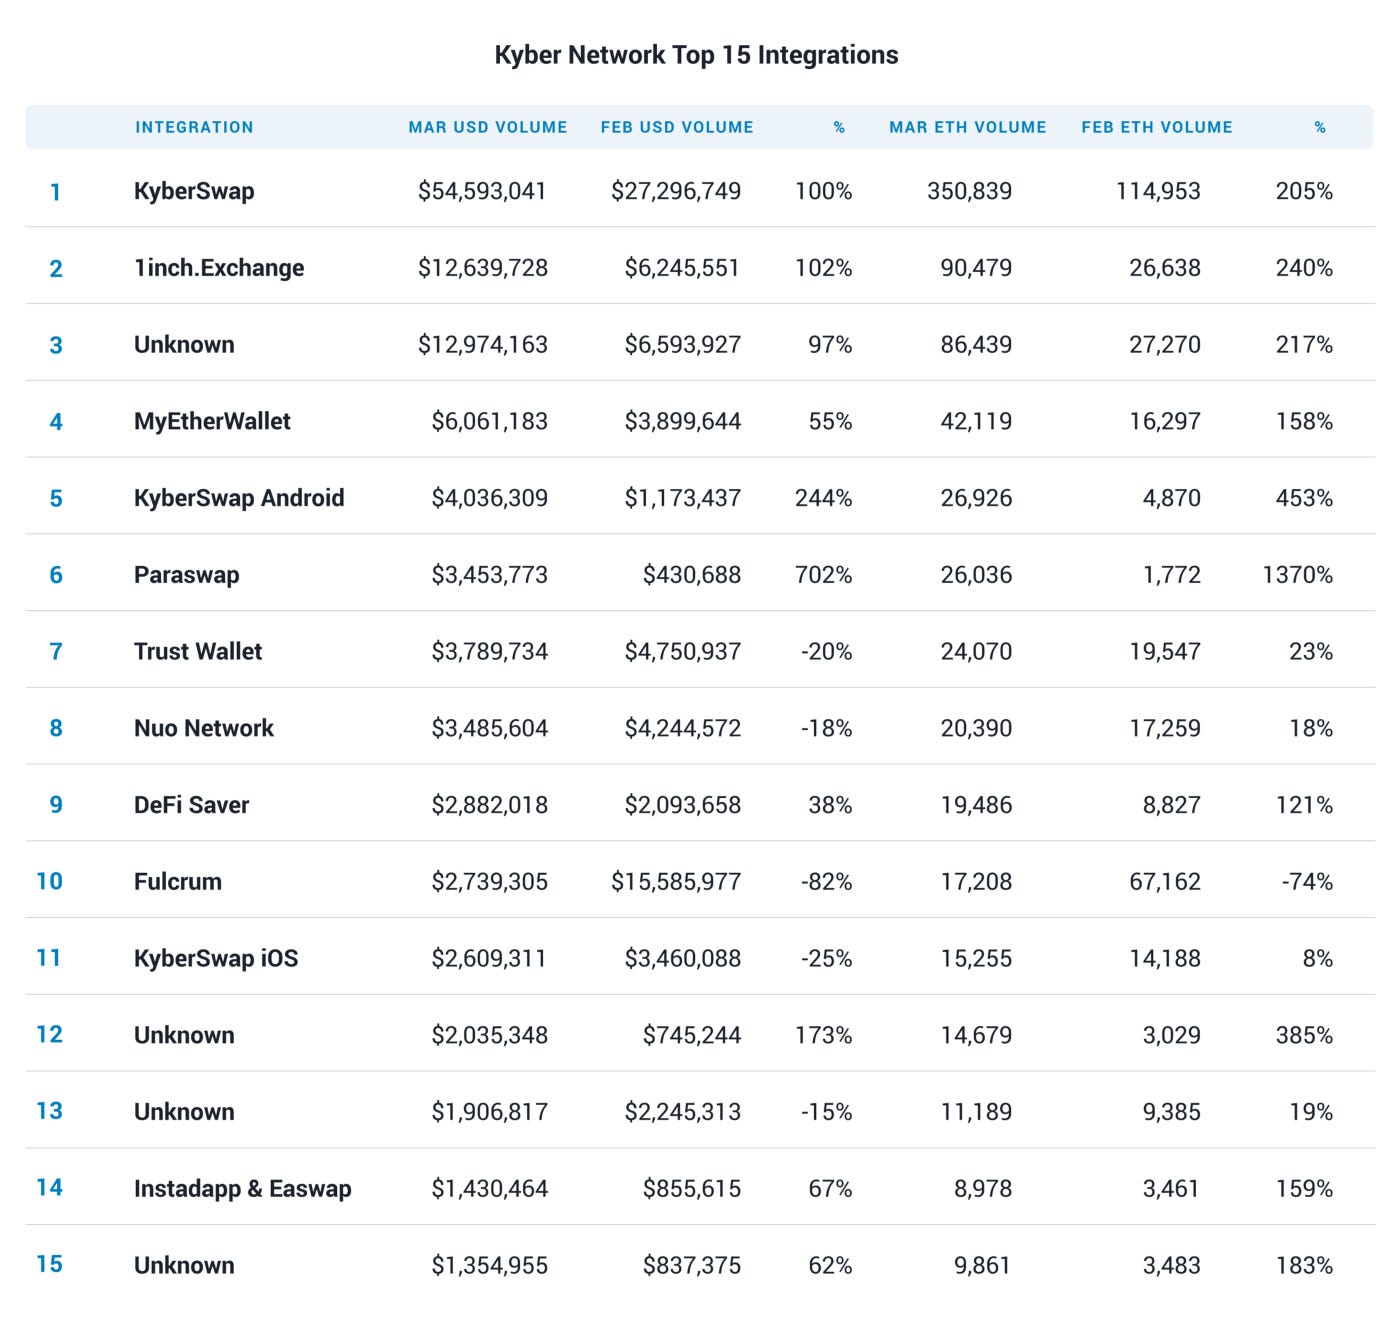
- The volatile market swings of mid-March saw many traders rush to the doors and exit to stablecoins. Exchange UIs like 1inch.exchange and Paraswap were well positioned to take advantage of this rush and saw their volumes surge significantly with Paraswap increasing its Kyber volume by 700% and 1inch.exchange by 100%. These two dex aggregators now make up the largest two DeFi integrations on Kyber.
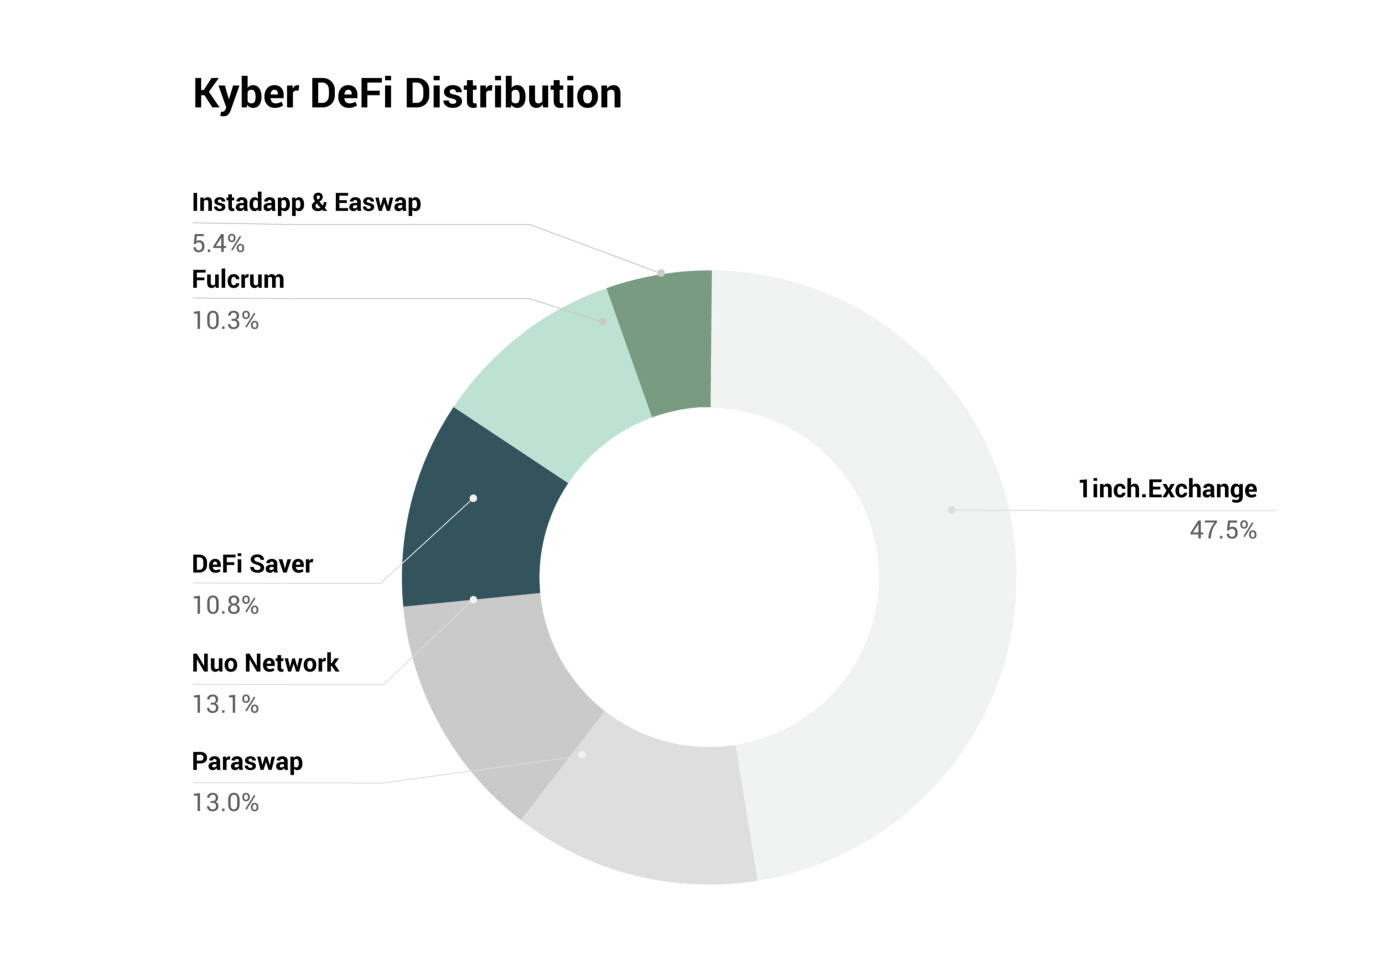
- In general, most consumers of Kyber liquidity saw strong month-on-month growth with five in particular growing by double digits in USD terms, and only one shrinking in ETH terms. These integrations include a mixture of DeFi dapps, wallets, KyberSwap products, and anonymous traders.
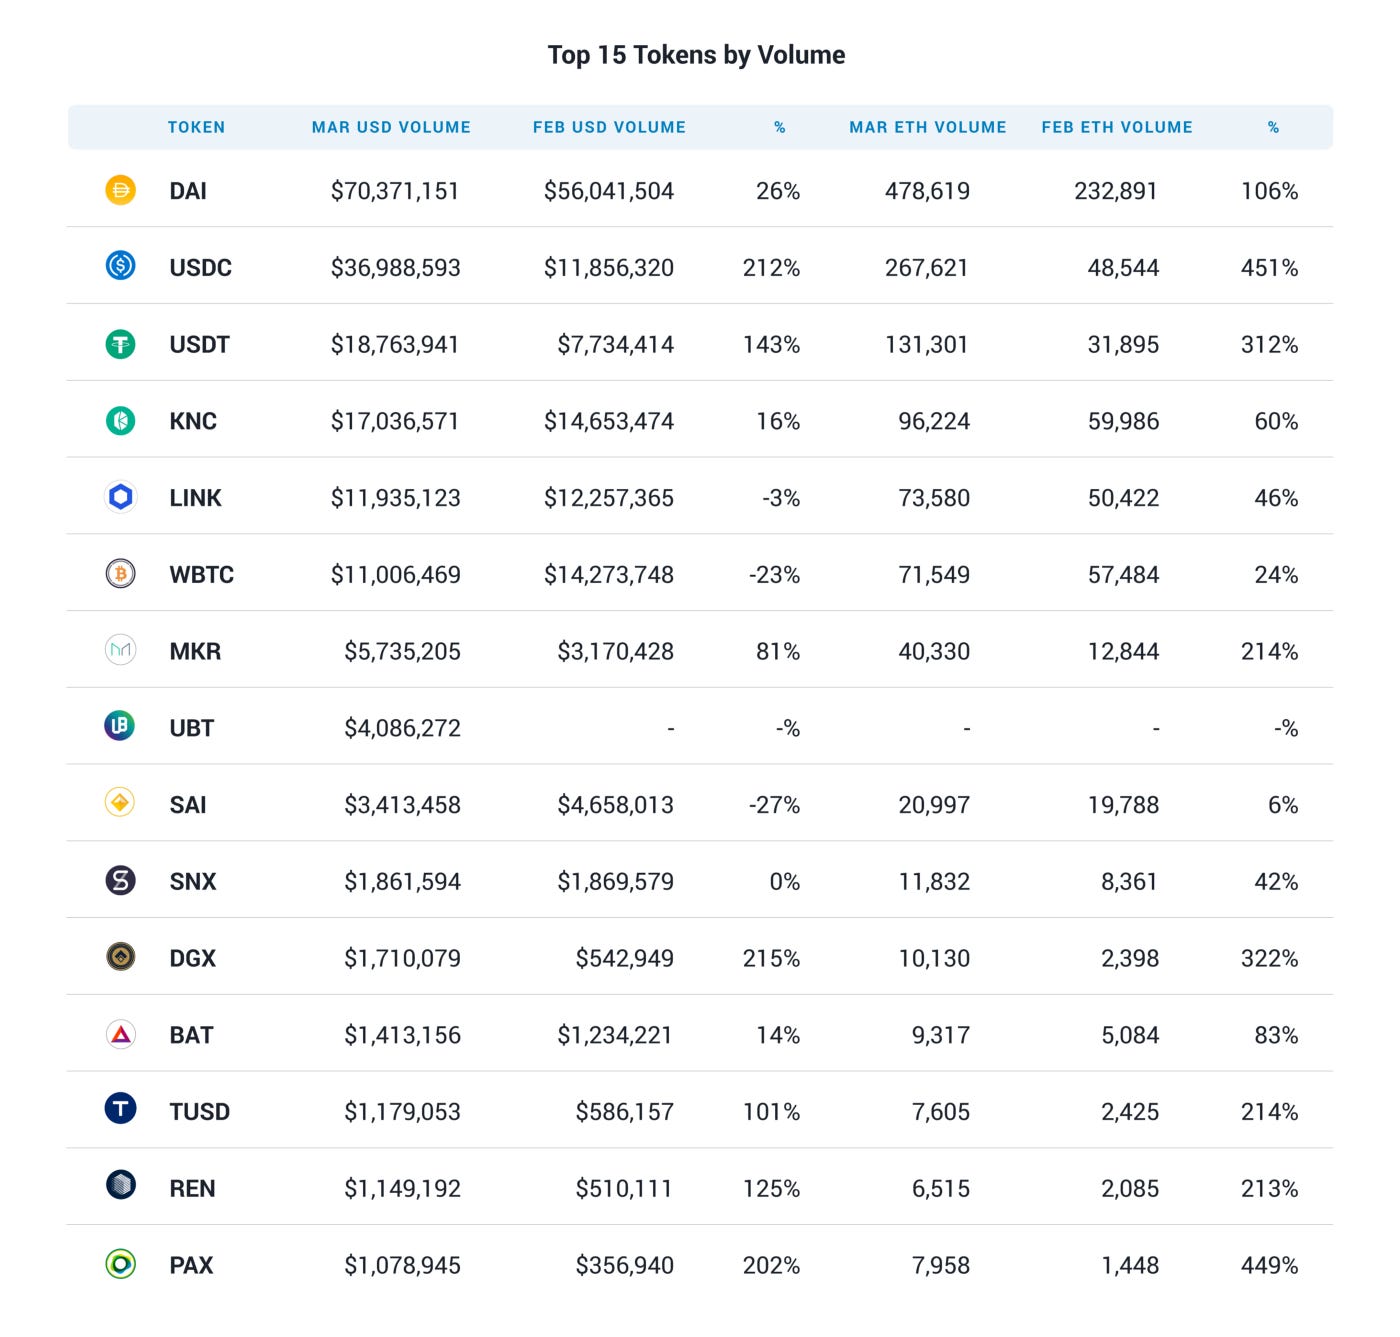
- Stablecoins have taken over the top 3 spots on Kyber Network and account for $128M of the $198M volume on Kyber in March. This is unsurprising given their safe haven status at a time when crypto assets lost up to 60% of their value within days during a particularly volatile period mid-March.
Contributor: Brock Elmore, Co-Founder of Topo Finance
- The dYdX protocol serves as an account system and money market for taking margin positions. It allows you to trade with any DEX on the ethereum network. At inception it used 0x and Oasis DEXs to source liquidity. Late last year they launched their native markets. These markets allow users to trade with each other. dYdX's native market has seen significant growth since launching last year. On Black Thursday (March 12th, 2020), dYdX saw massive influx in amount traded, despite having to increase the minimum trade amount. (at the peak, the minimum amount was 50 ETH). That minimum clearly didn't matter much to users.
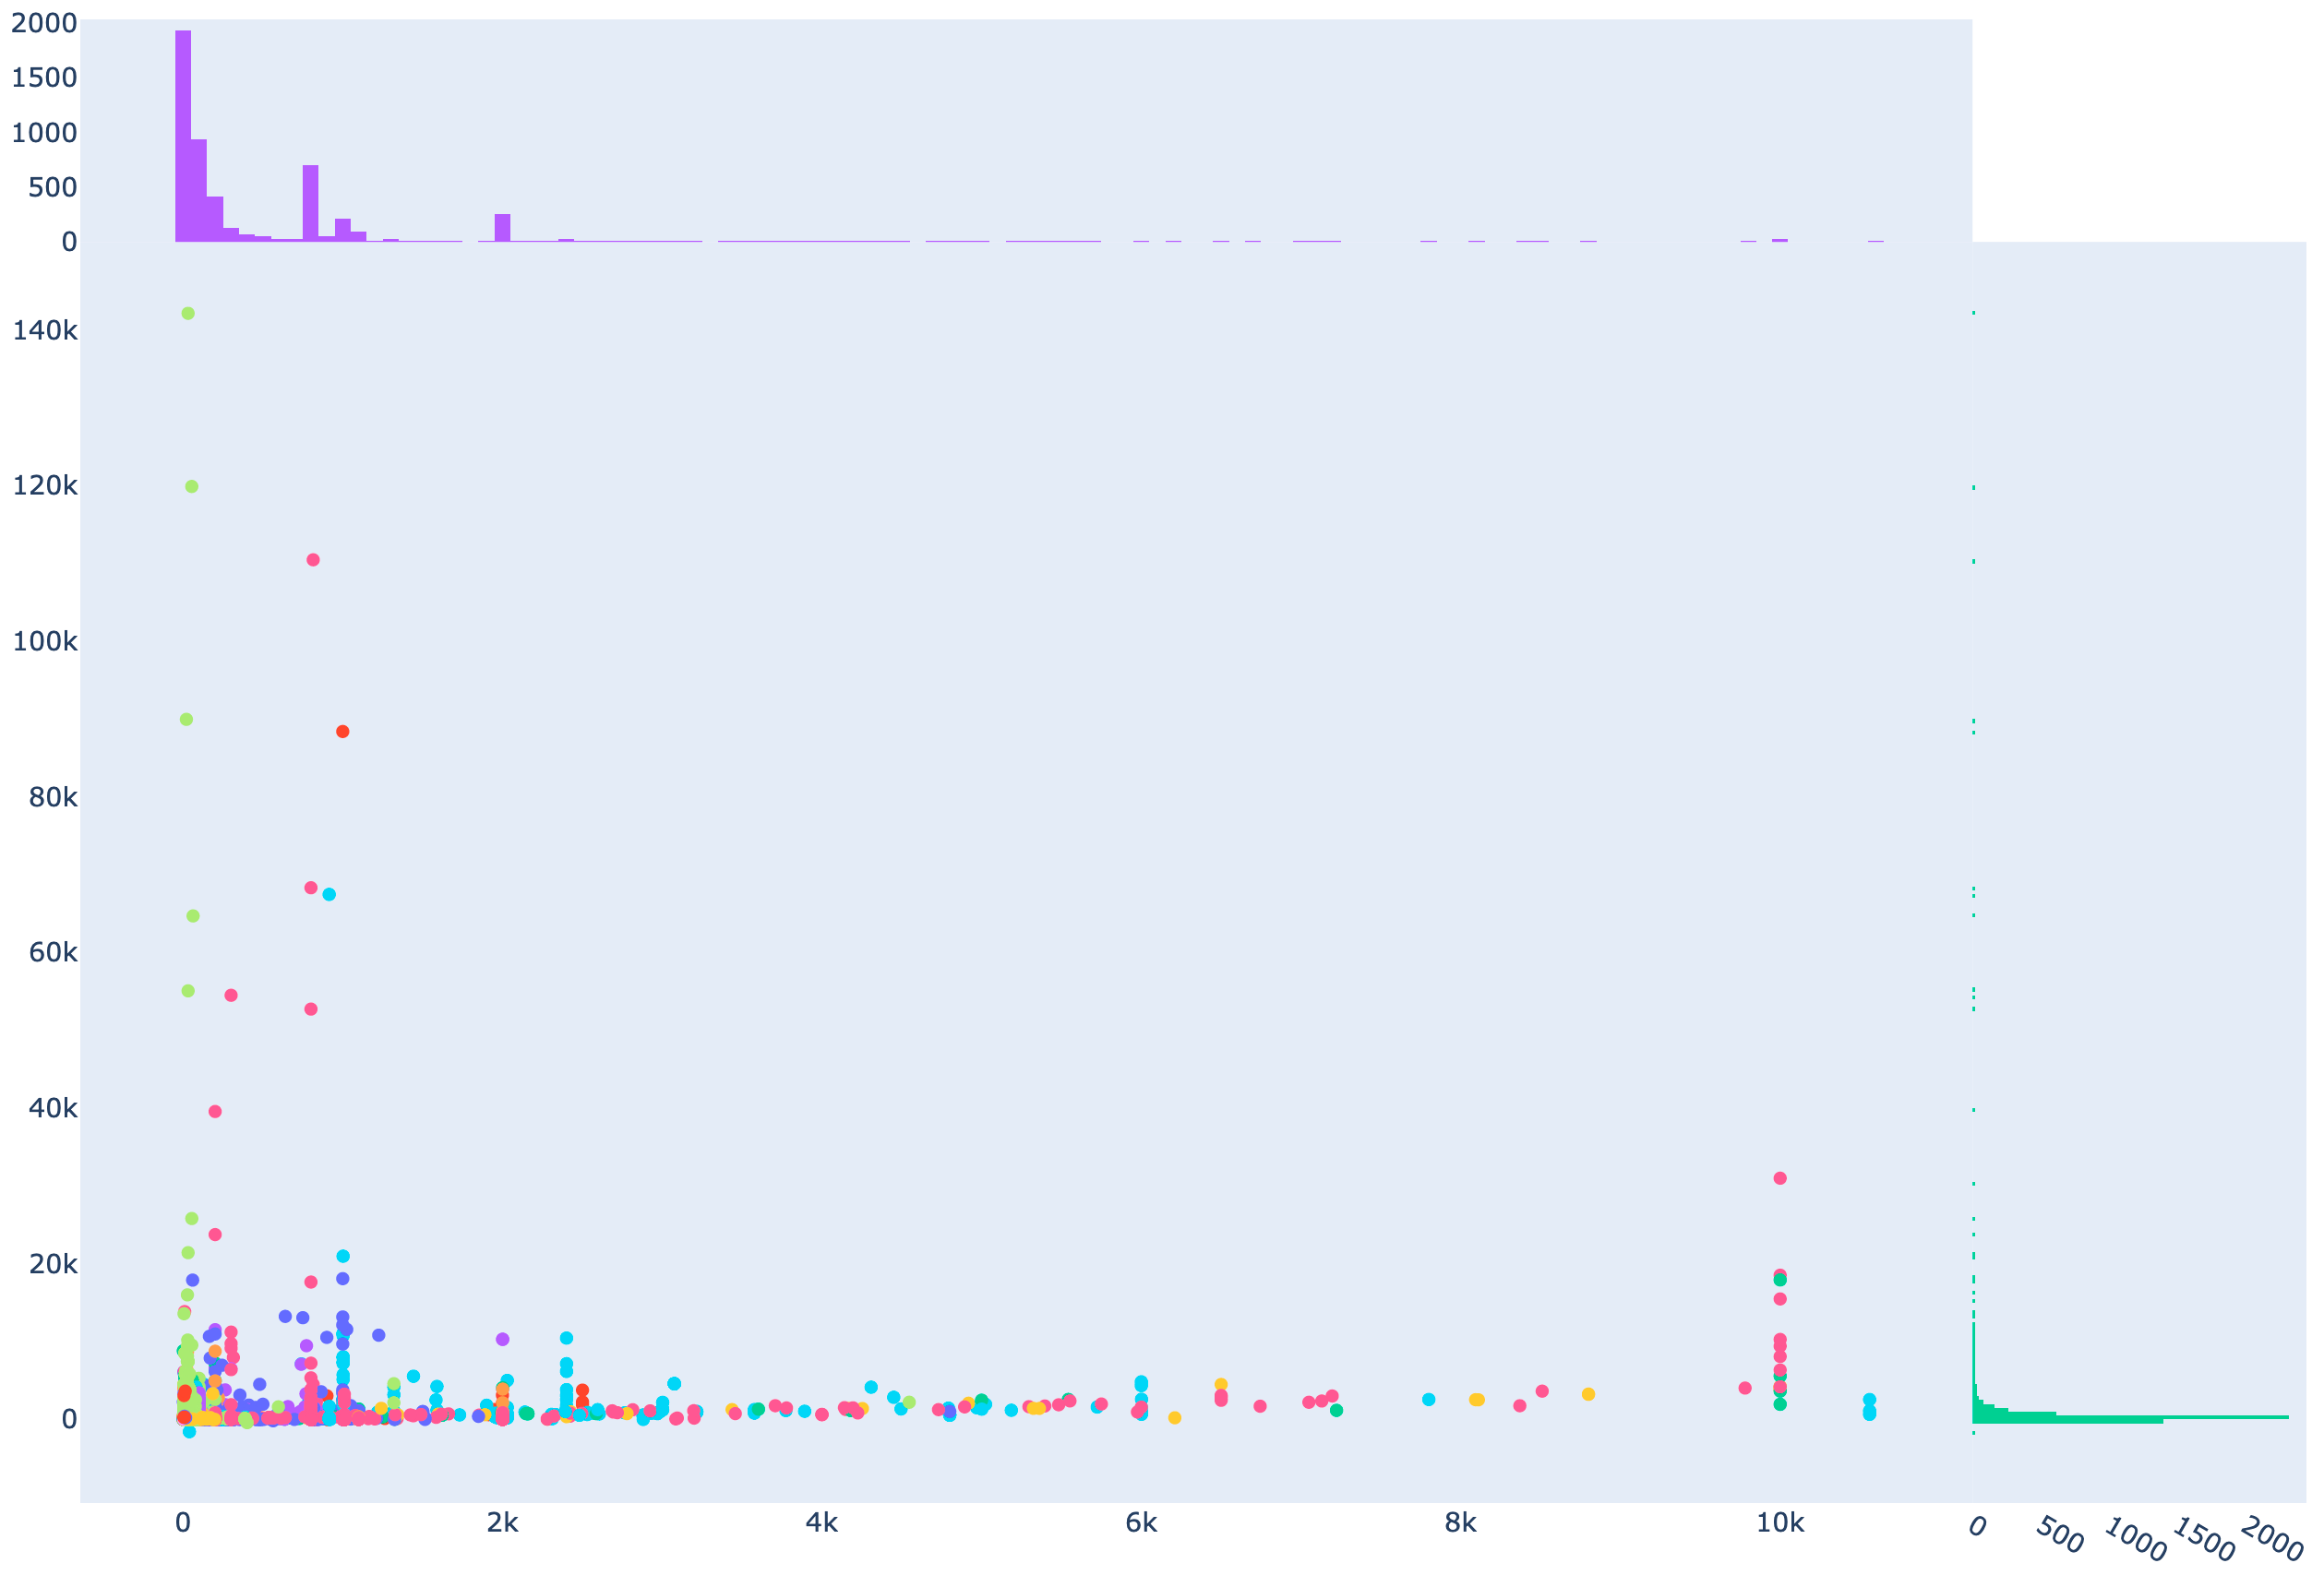
- Continuing the Black Thursday theme, dYdX offers margin and like other money markets on ethereum, if a position becomes undercollateralized it can be liquidated. The minimum collateralization ratio is 115% in the protocol. If it falls below, the collateral is exchanged at a 5% discount to the liquidator in exchange for taking on the users debt. This collateral can be sold on a DEX or sit on the liquidators books. How profitable is it? Here is a graph where y-axis is profit (net of network tx fees), and x-axis is the gas price in Gwei. As you can see, there are liquidations with profits in excess of $100k. (Note: points are colored by the liquidating addresses.)
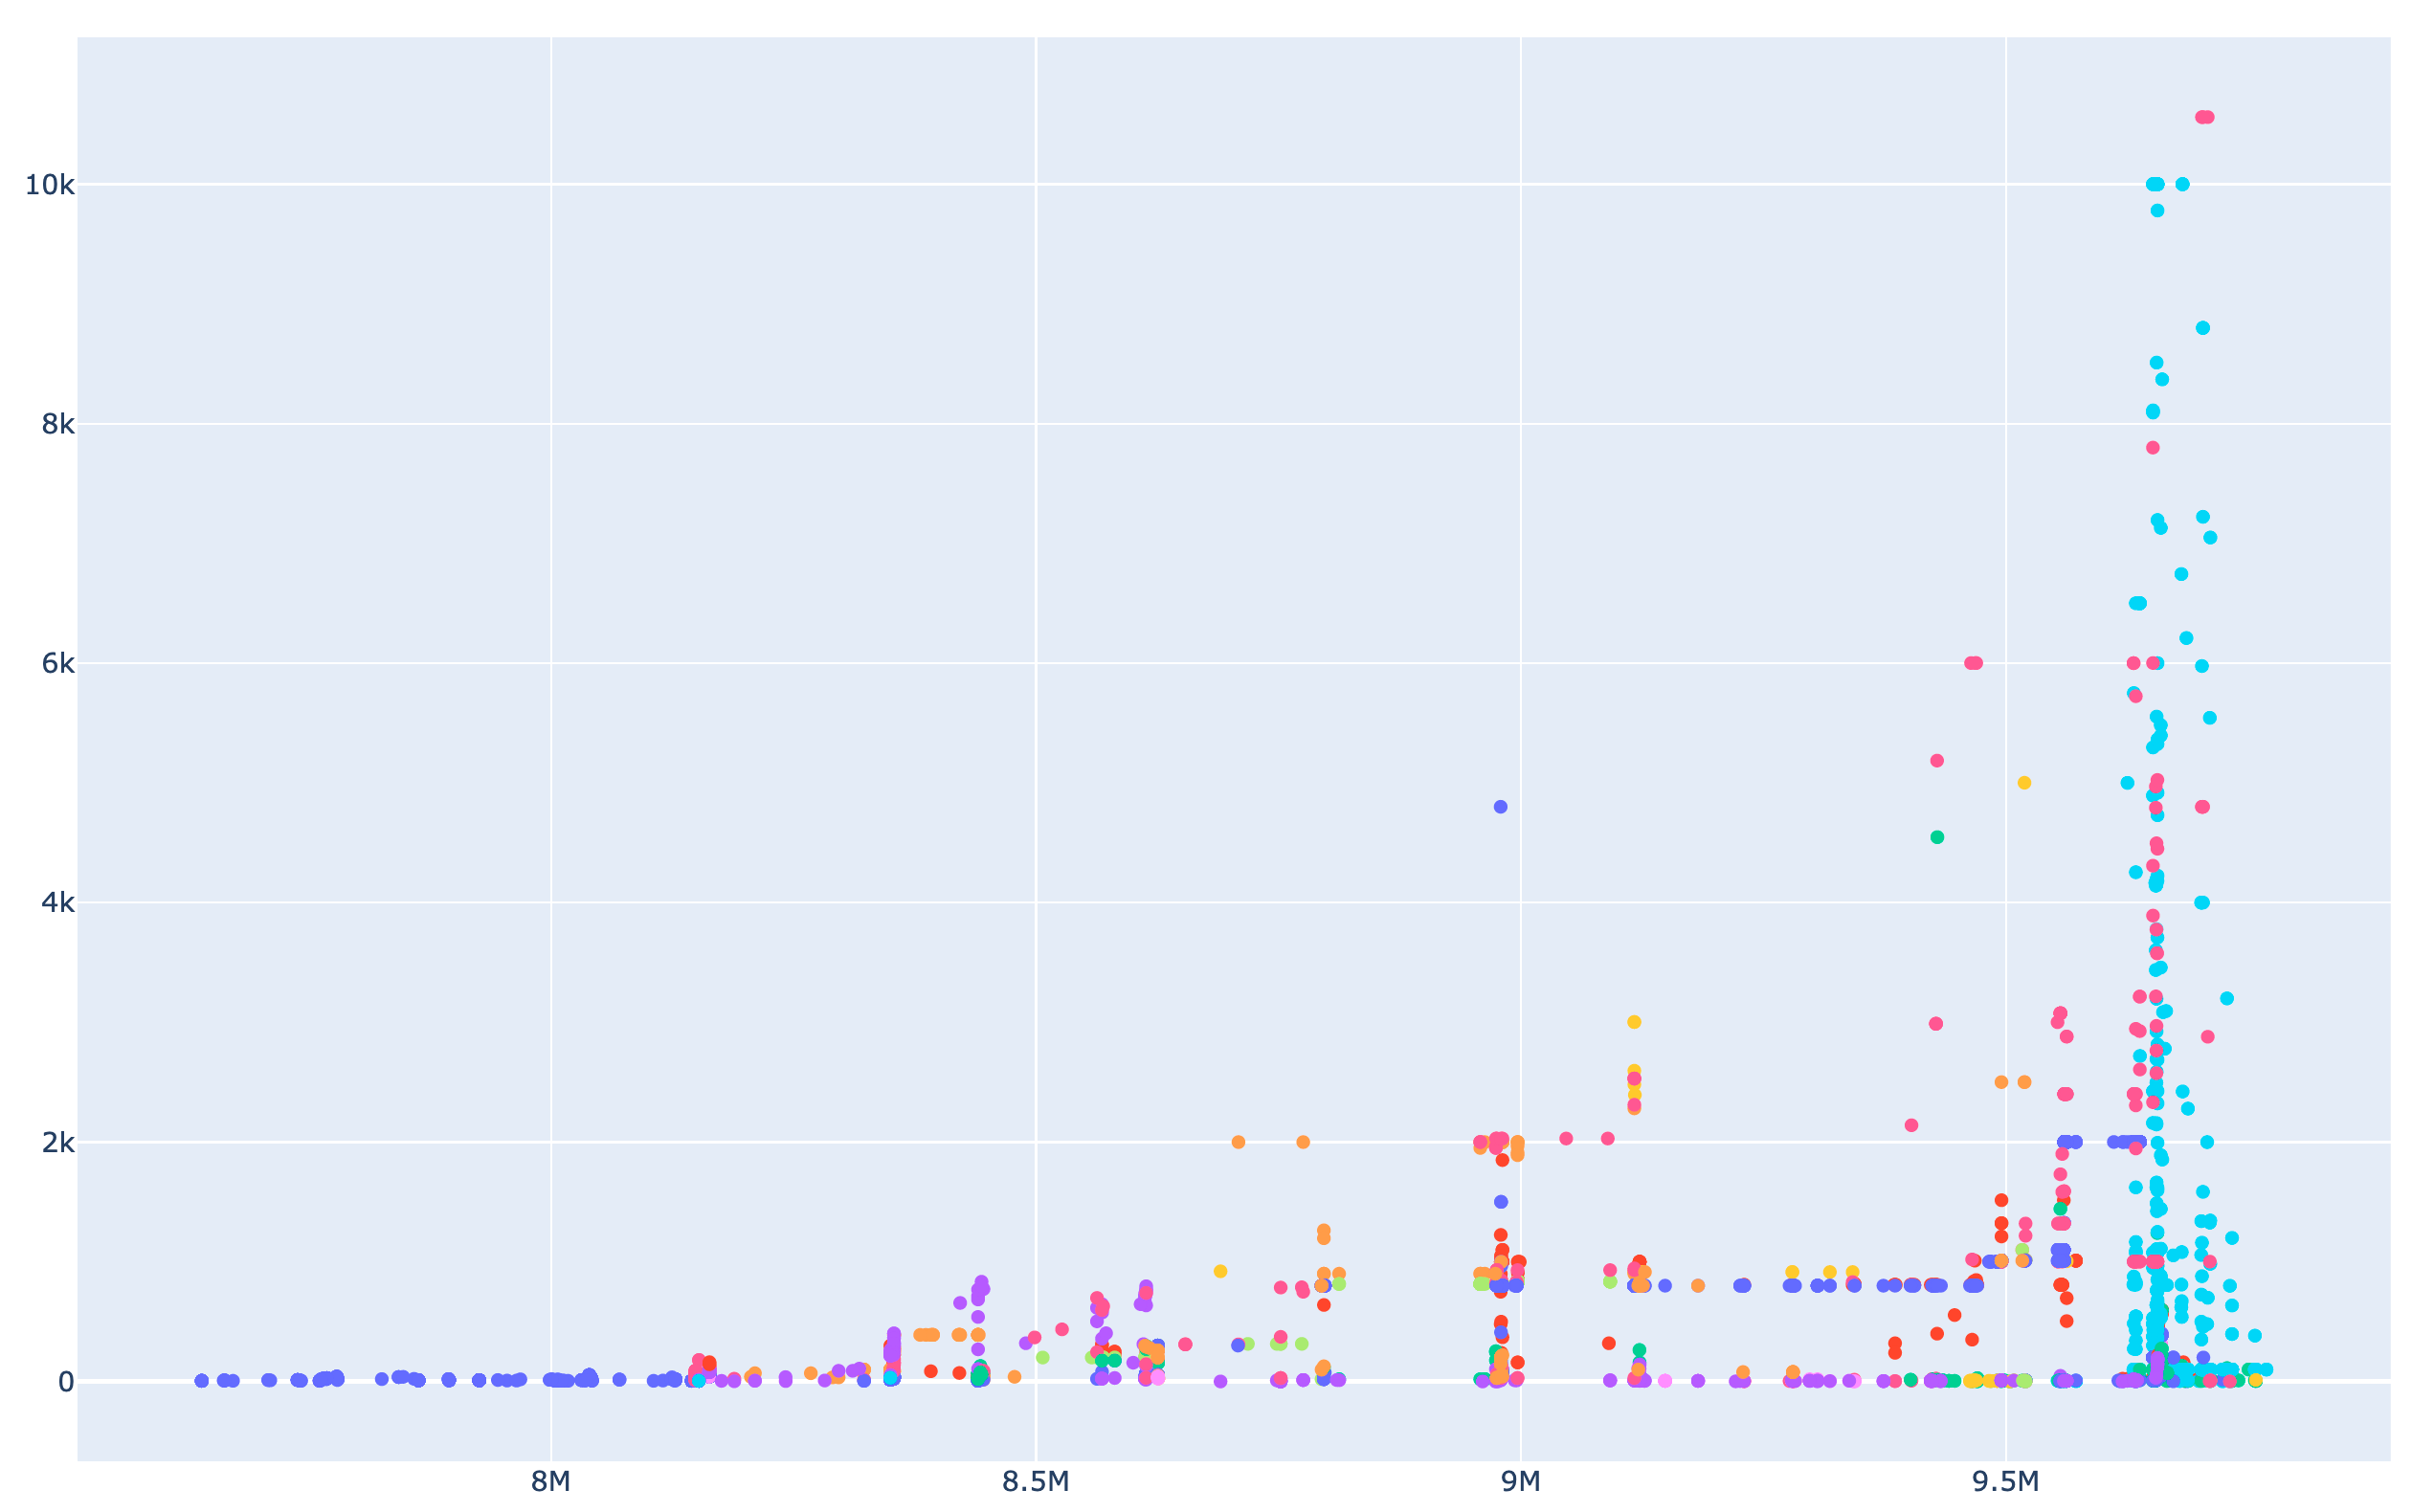
- How competitive has liquidations become given the potential for profit? Here is a chart showing the gas price paid on the y-axis and the block number in which the liquidation occurred. Also colored by the liquidator address. Clearly the liquidation market is healthy and competitive with increasing gas price starting to squeeze profits lower. This is good for the protocol as it makes sure that undercollateralized accounts are liquidated before the collateralization drops below 100% (at which point it would be unprofitable to liquidate). dYdX has an insurance fund if liquidators did not liquidate an account because it would be unprofitable.
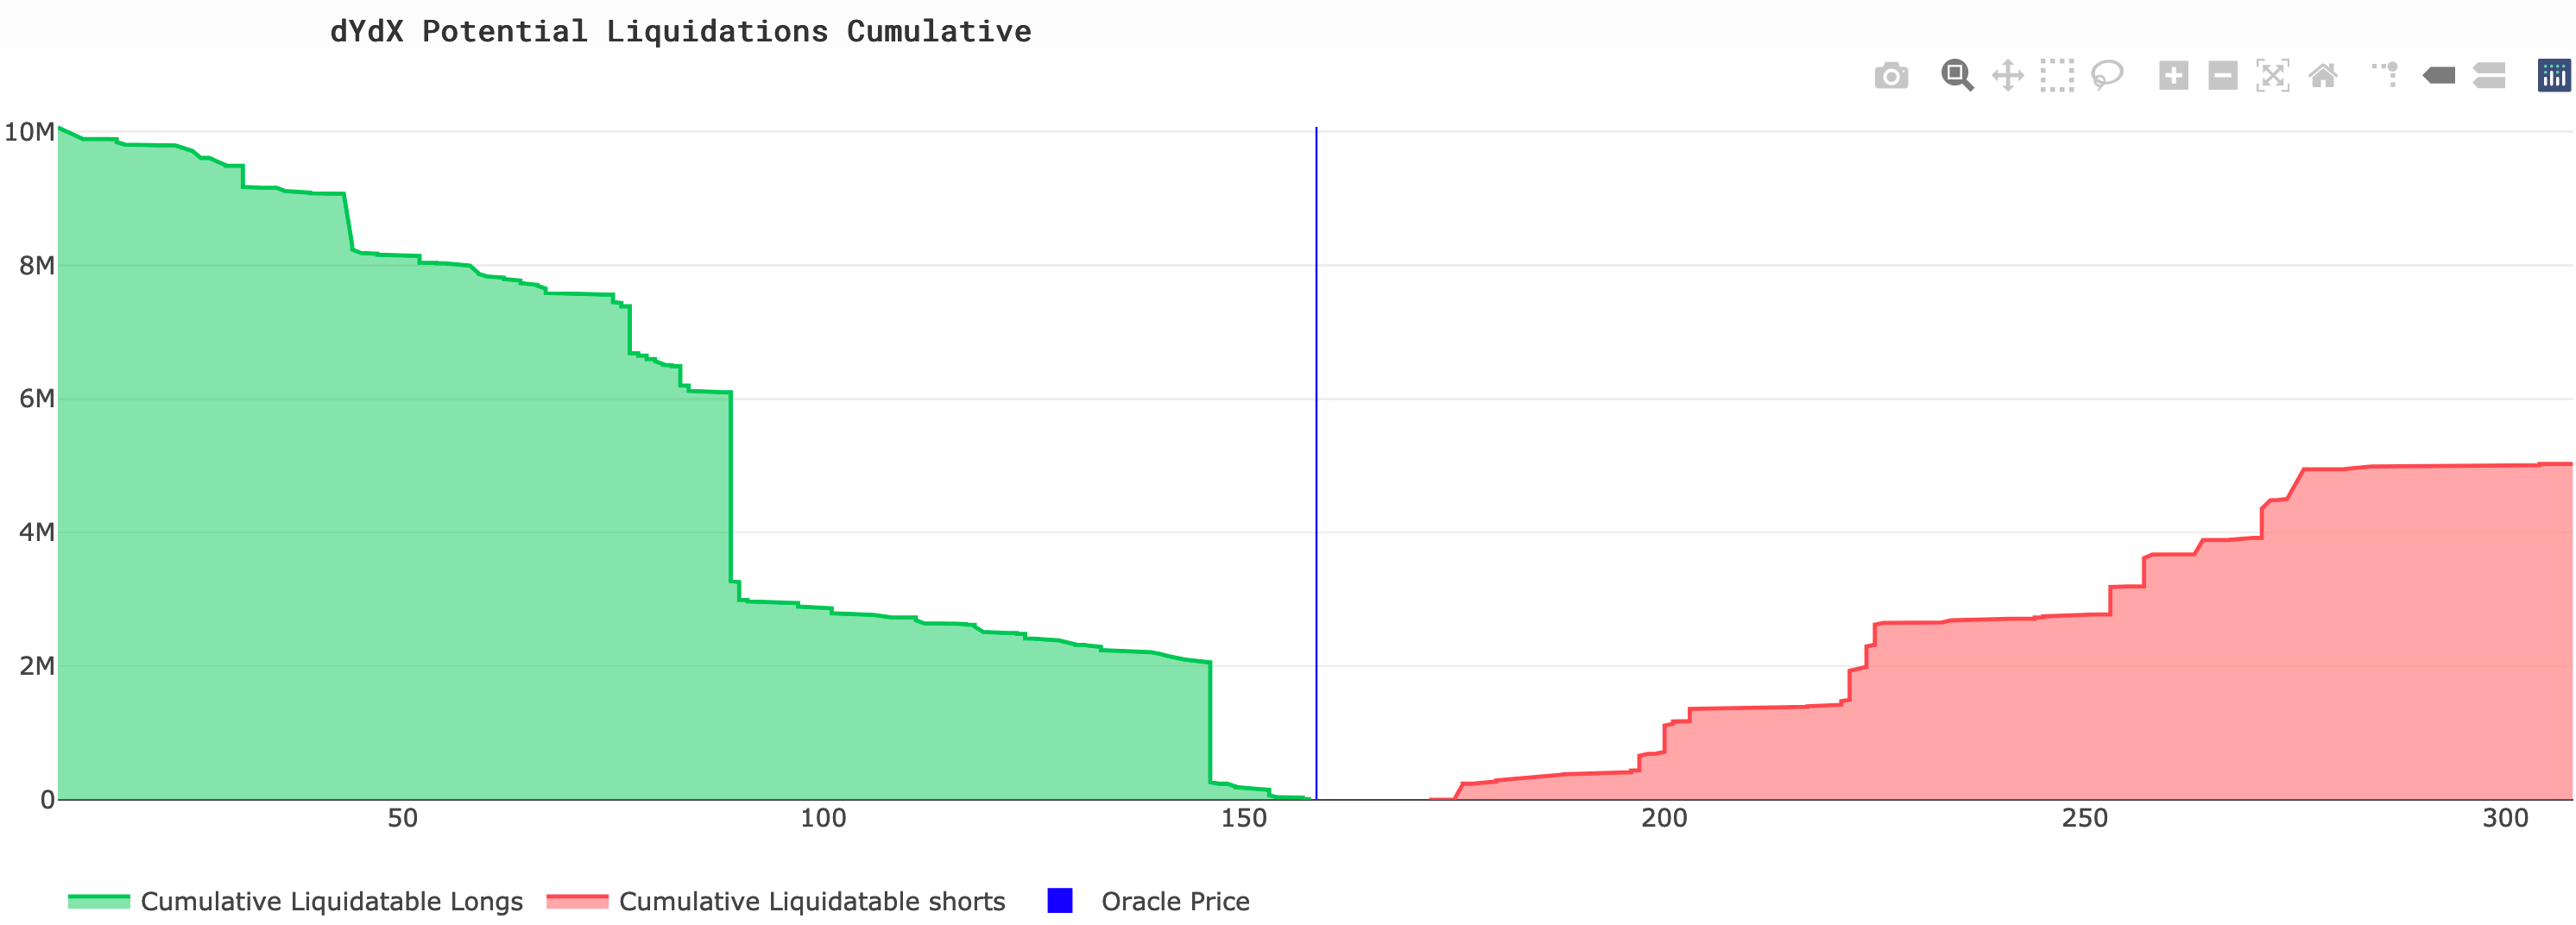
- One benefit of blockchain is that we can easily see the net position of every account in the system. We can also calculate the price at which an account would be liquidated. Below is a chart showing how much in USD would be liquidated if price moves to a particular amount.
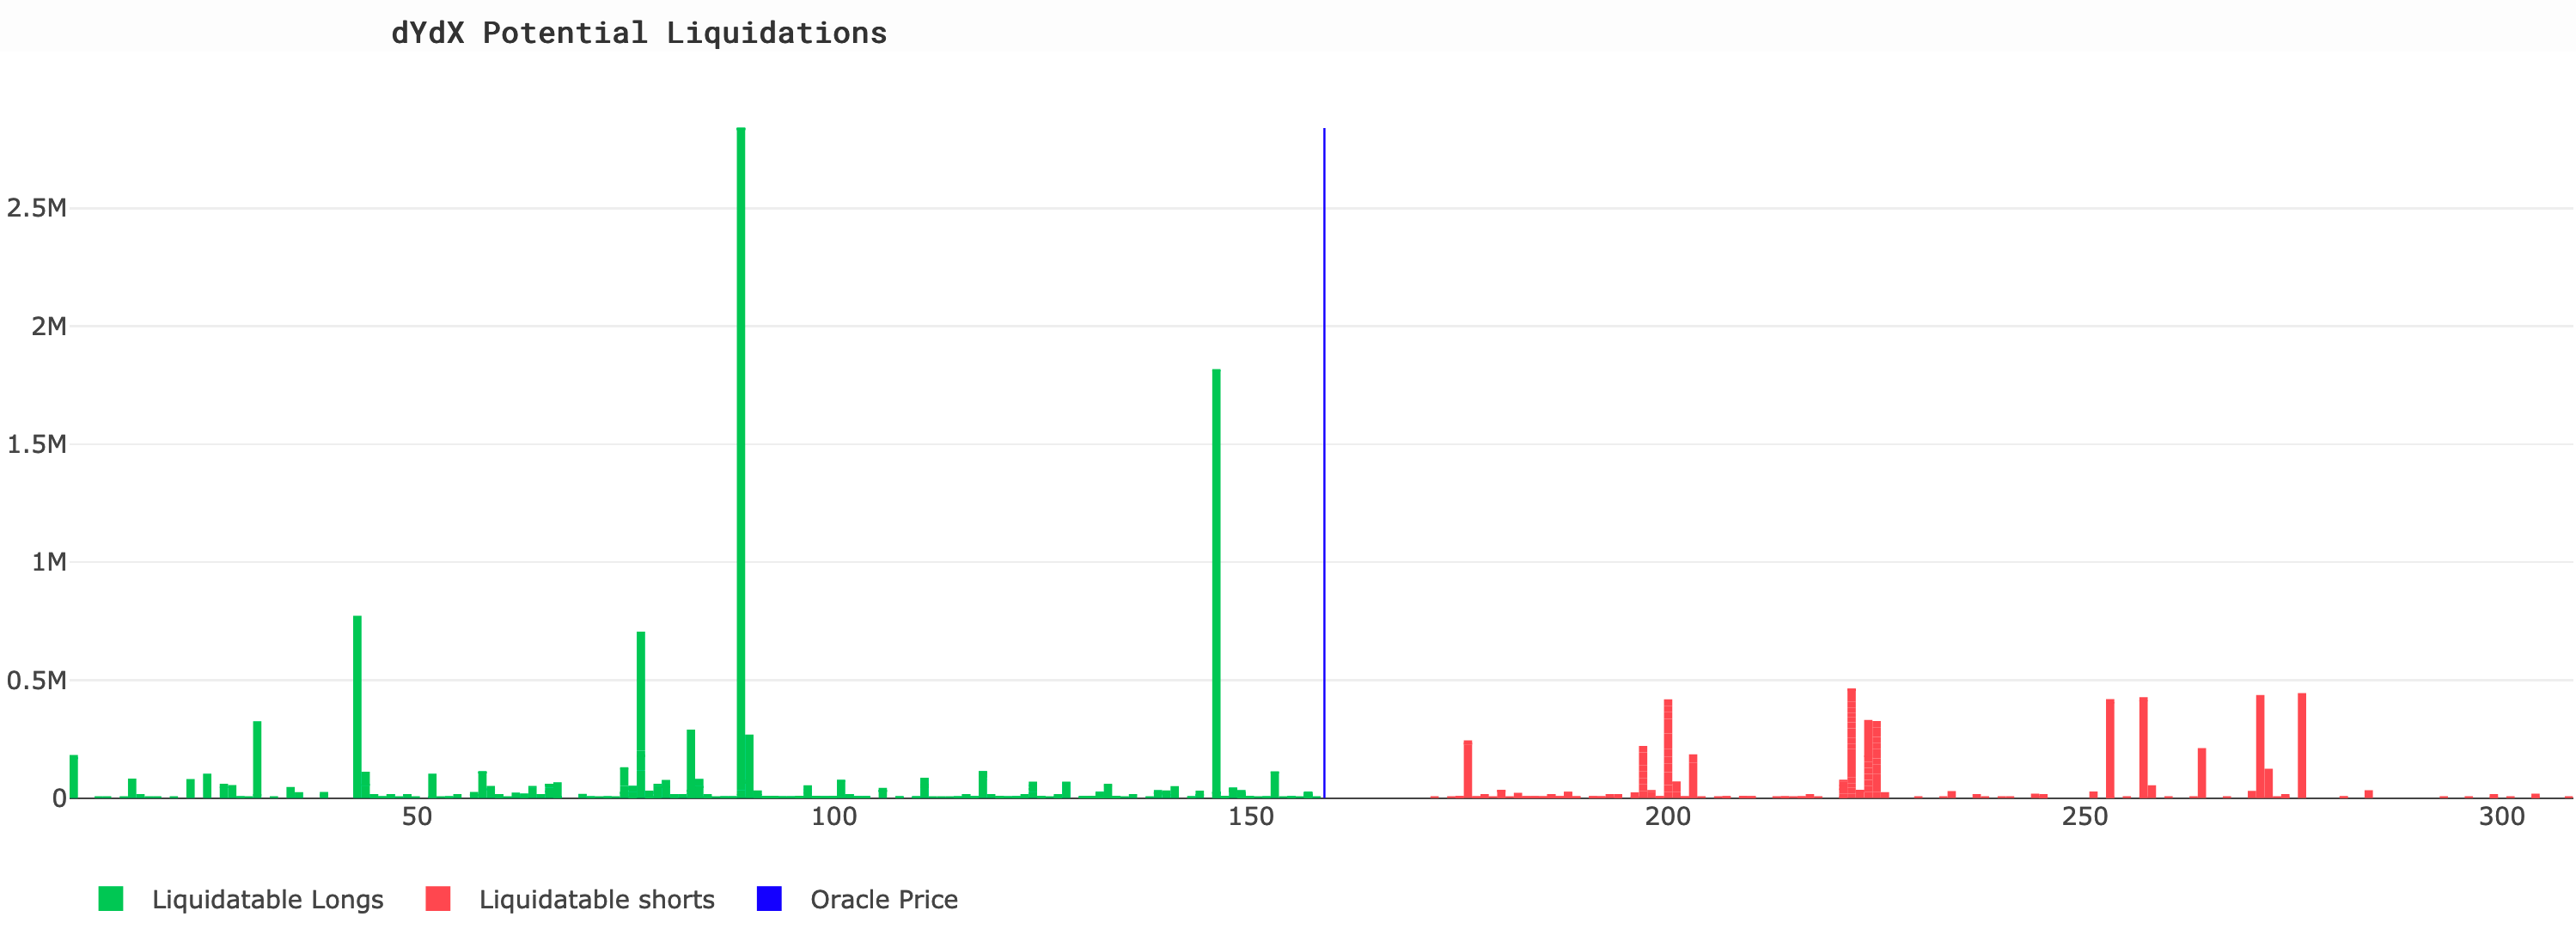
- Here are the discrete positions and at what price they would be liquidated as well (above is cumulative).
About the editor: Spencer Noon leads investments for DTC Capital, a fundamentals-focused crypto fund. He actively tweets about on-chain metrics.