ON–002: Layer 1s
Jan 3, 2020

Welcome to Issue #2 of Our Network, a weekly newsletter where top blockchain projects and their communities share data-driven insights about their networks.
This week our contributors are covering the following Layer 1 cryptocurrencies:
- Bitcoin
- Ethereum
- Decred
- Tezos
While each of these networks is making a credible attempt to secure a long-term monetary premium and Store of Value status, their respective monetary policies, consensus mechanisms, expressiveness, and governance systems differ considerably.
Such diversity is what makes evaluating L1 network health so challenging. There are metrics that can be compared across all blockchains — and we’ve really only scratched the surface of all of the on-chain data we have at our disposal — but metrics alone are incomplete without context (e.g. it’s trivial to fake transactions on a no-fee blockchain) and narrative (e.g. how should a network be used?).
Our Network was designed precisely to address these challenges. All of our contributors either work directly for the projects themselves or are active community members. I think of them as world-class river guides for their respective networks, and I’ll be doing my part to mostly stay out of their way as they deliver interesting insights and interpretations on a weekly basis.
— Spencer

Contributor: Nate Maddrey, Research Analyst at Coin Metrics
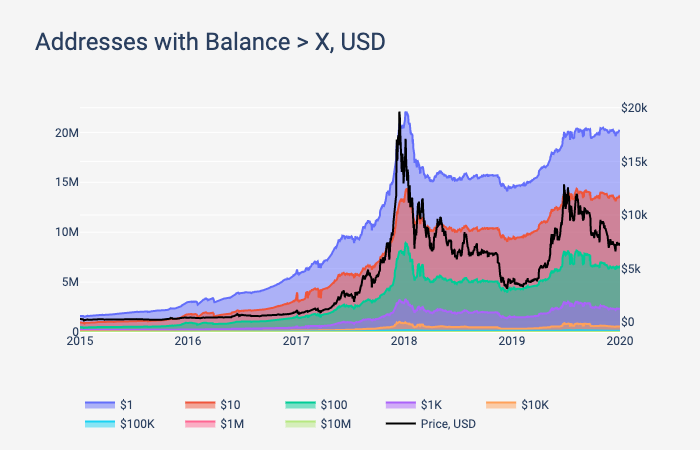
- The number of Bitcoin (BTC) addresses with a balance of at least $1 and of at least $10 are close to reaching all-time highs, despite the recent BTC price drop. In January 2018, there were a little over 22,000,000 addresses that held at least $1. As of Dec. 31st, 2019 there are over 20,000,000 addresses with a balance of at least $1.
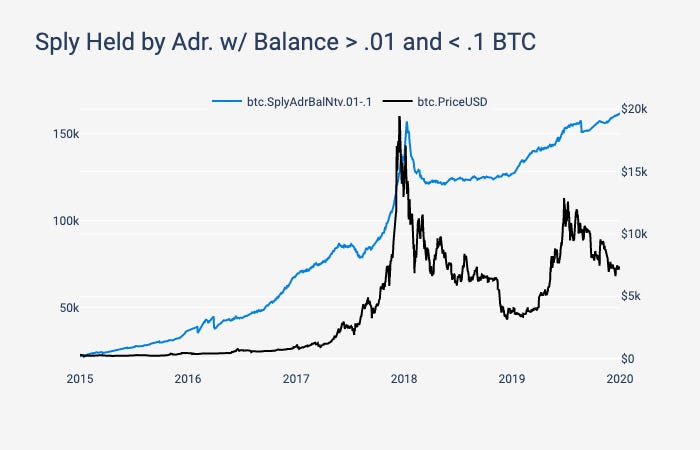
- The total amount of BTC held by addresses with relatively small balances is also increasing. As of December 31st, addresses holding balances between .01 and .1 BTC (which is equivalent to about $70 and $700 at current prices, respectively) collectively held about 161,000 BTC. This is more than the previous all-time high of a little over 157,000 BTC set in January 2018.
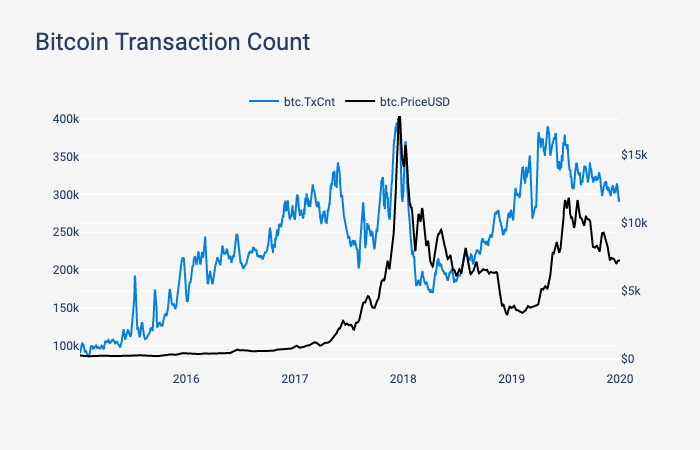
- Bitcoin had an average of about 328,000 daily transactions over the course of 2019. Transaction count peaked in June but has still remained relatively high through the end of the year.
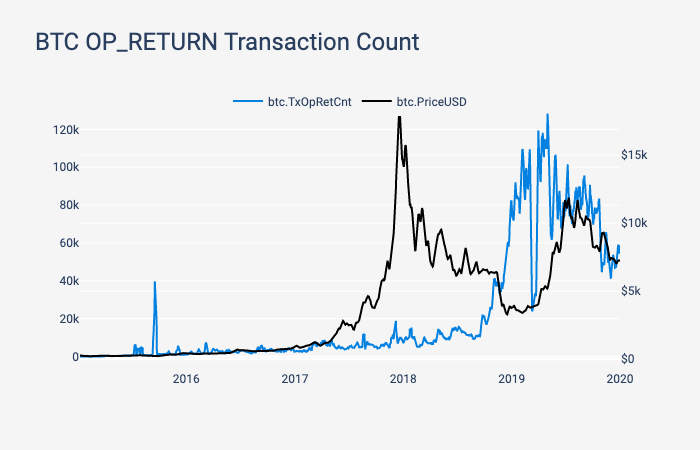
- A lot of the Bitcoin transaction count growth was due to OP_RETURN transactions, which surged over 2019. OP_RETURN transactions are often used to store data on-chain but can also be used for other reasons such as burning BTC. BTC OP_RETURN transactions count appeared to have spiked in May, and has been decreasing since.
Contributor: Maksim Balashevich, founder of Santiment
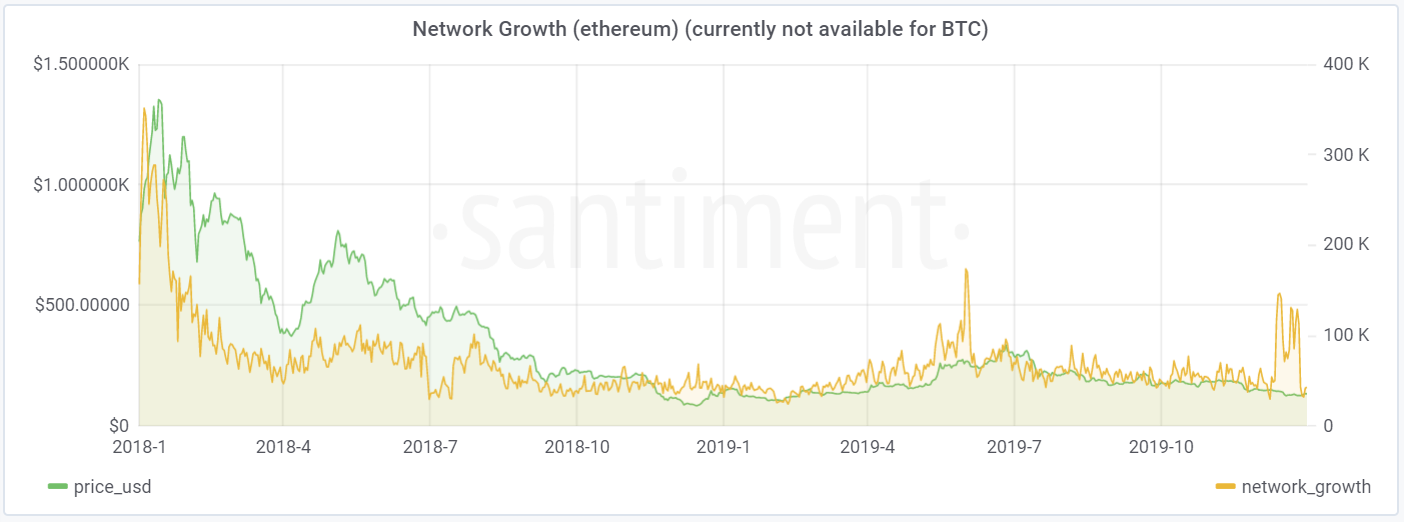
Network growth shows the number of new addresses being created each day and is a useful proxy for user adoption over time. It can also point to cycles when an asset is gaining or losing traction. As of mid-December, we have seen a steep rise in Ethereum network growth, with the highest frequency of new addresses added to the network since June 2019.
Overall though, the total number of new addresses created on the Ethereum network is down 29% this year — from 28m in 2018 to 19.9m in 2019. Part of the reason is the massive amount of new addresses added to the network during the price peak back in January of 2018, which still eclipses all on-chain activity since.
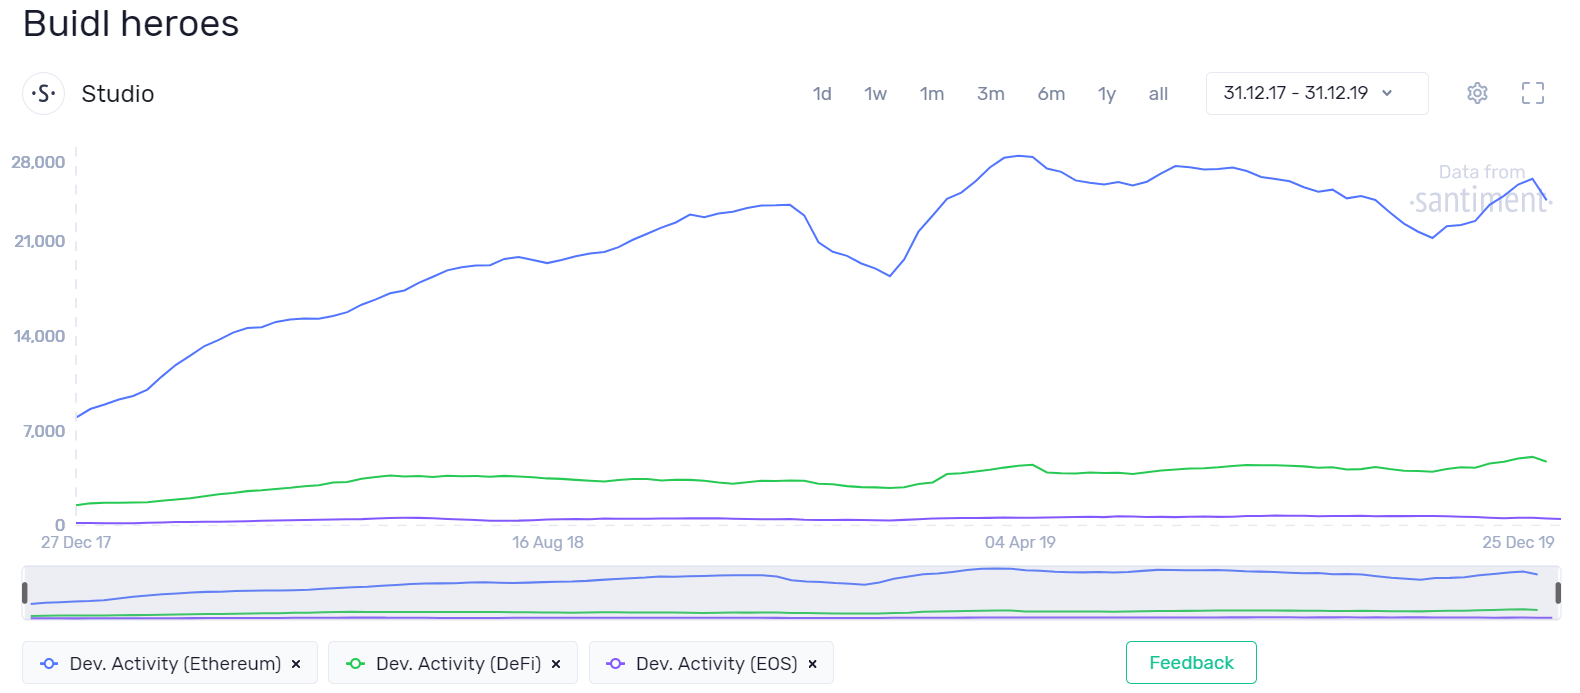
Development activity is a great way to analyze the amount of coding manpower a project has invested over a period of time. At Santiment, we have developed a custom approach for tracking the GitHub development activity of crypto projects which eliminates skewed GitHub data and obvious stat-padding.
According to our data, Ethereum-based dapps have invested about 34 times more development resources over the last 12 months compared to their EOS counterparts. Regardless of their native platform, it has also been a big year for DeFi-centered projects, whose aggregate development activity has charted new highs throughout 2019:
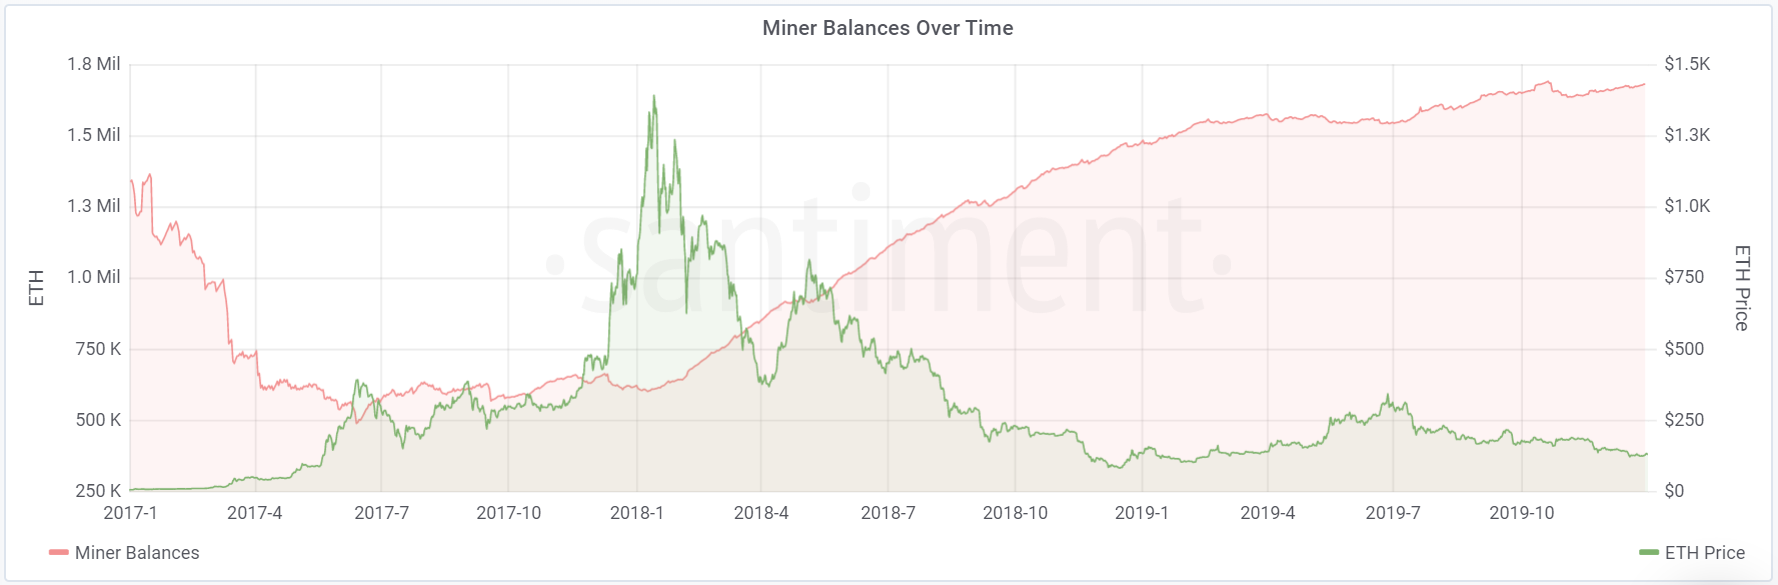
- In 2019, the cumulative balance of Ethereum miners has grown by 13.08% — from 1.483m ETH to 1.677m ETH. The periods of accumulation can indicate fairly high confidence levels among ETH miners, at least in relation to the asset’s short-term performance. The chart does show a sudden change in miner behavior (short-term selloff) during the summer rally, after which the pools revert back to accumulating.
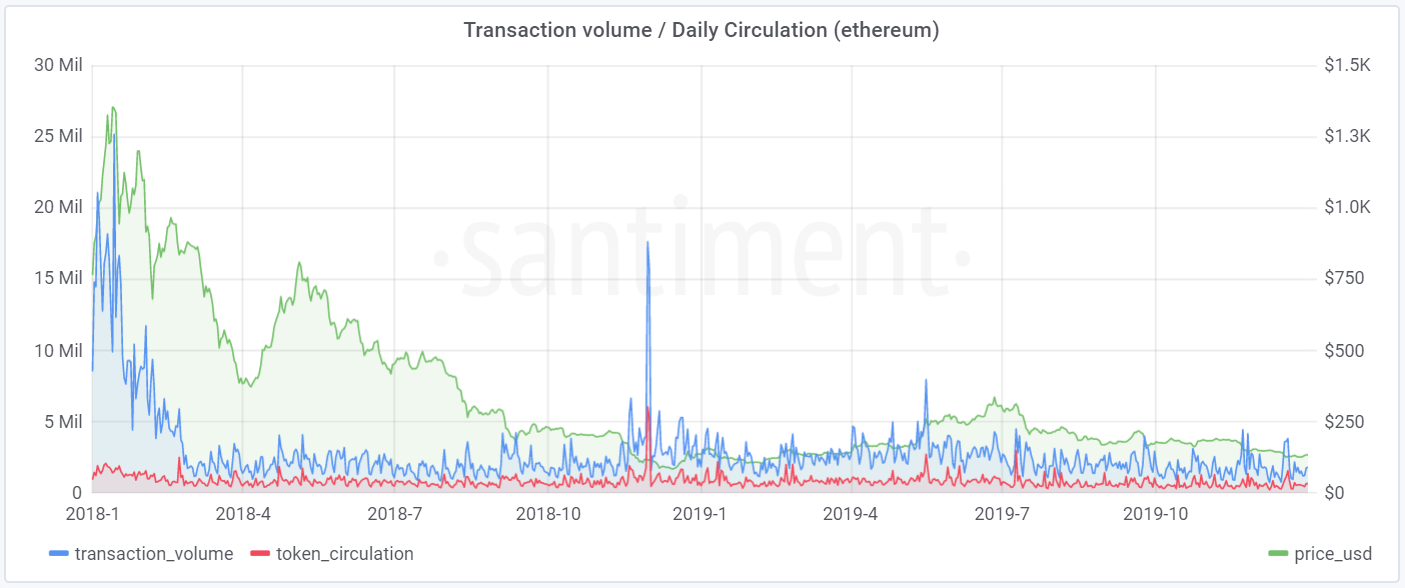
There’s been a noticeable drop-off in total value transmitted on the Ethereum network in 2019. A total of 1.2B ETH were exchanged between addresses on the network in 2018; this year, that number’s been cut by a full third — down to 830M ETH overall. The drop-off should be observed in proper context, though — the biggest spike in transactional activity on the Ethereum network in 2018 was during the January price peak when speculative interest was exceptionally high.
Furthermore, Ethereum’s marketcap is just below breakeven for the past 12 months while Bitcoin recorded annual growth of over 85%, so it’s understandable that some speculative rigor may have shifted to other networks relative to the year prior. Although transaction volume has remained fairly steady since the steep decline of transactions occurred in late February 2018, token circulation (# of unique active tokens exchanged on a given date) has been gradually declining for two years.
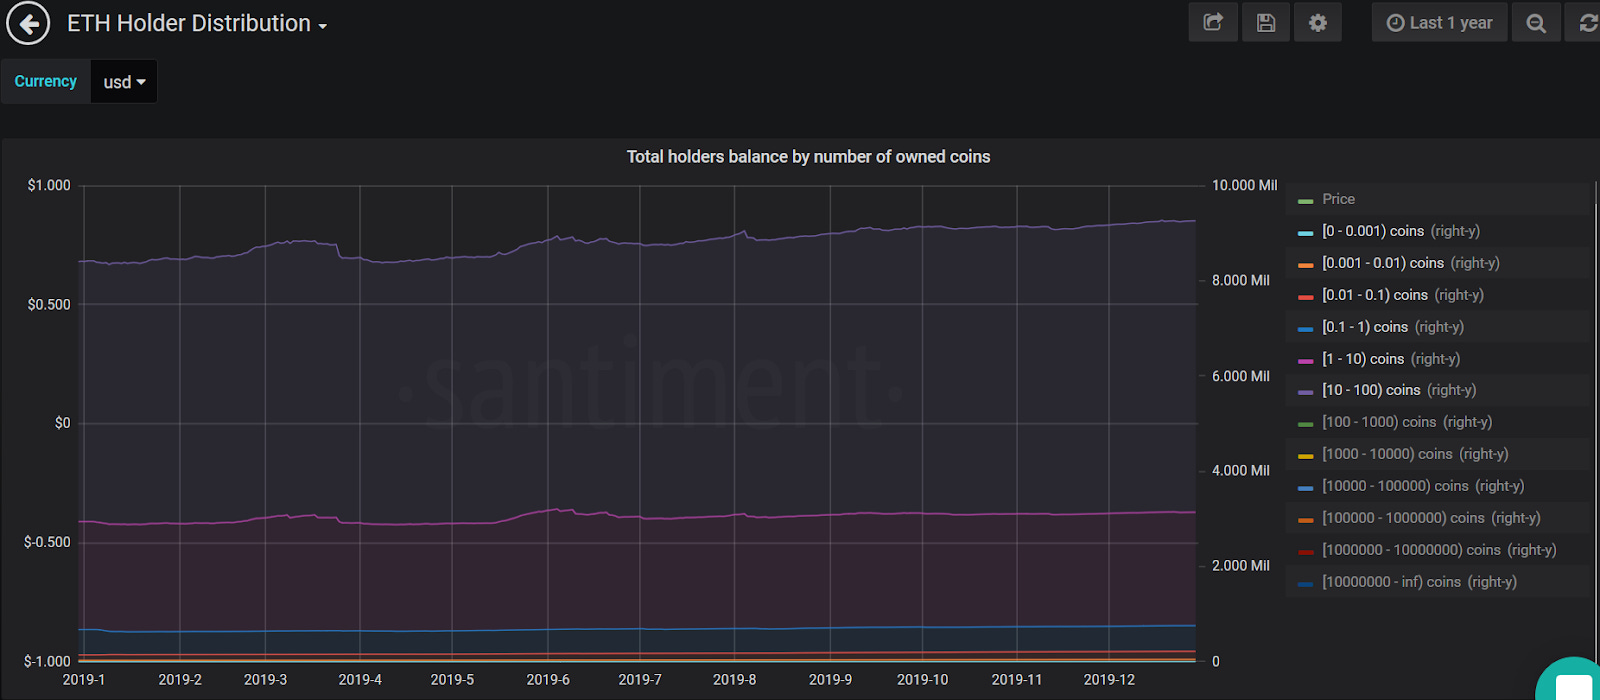
- In 2019, retail holders (addresses with 0.001 - 10 ETH) have increased their cumulative balance by 195k ETH, a 6.63% increase since January 1st. While greater token distribution among the retail section bodes well for the health of the network, these addresses still only account for 2.85% of Ethereum’s total circulating supply. The bulk of existing ETH remains in two major holder subsections: (1) addresses holding between 10k - 100k ETH, owning 23.7% of total supply and (2) addresses holding between 100k - 1m ETH, owning 32.5% of total supply.
Contributor: Checkmate, Decred contractor
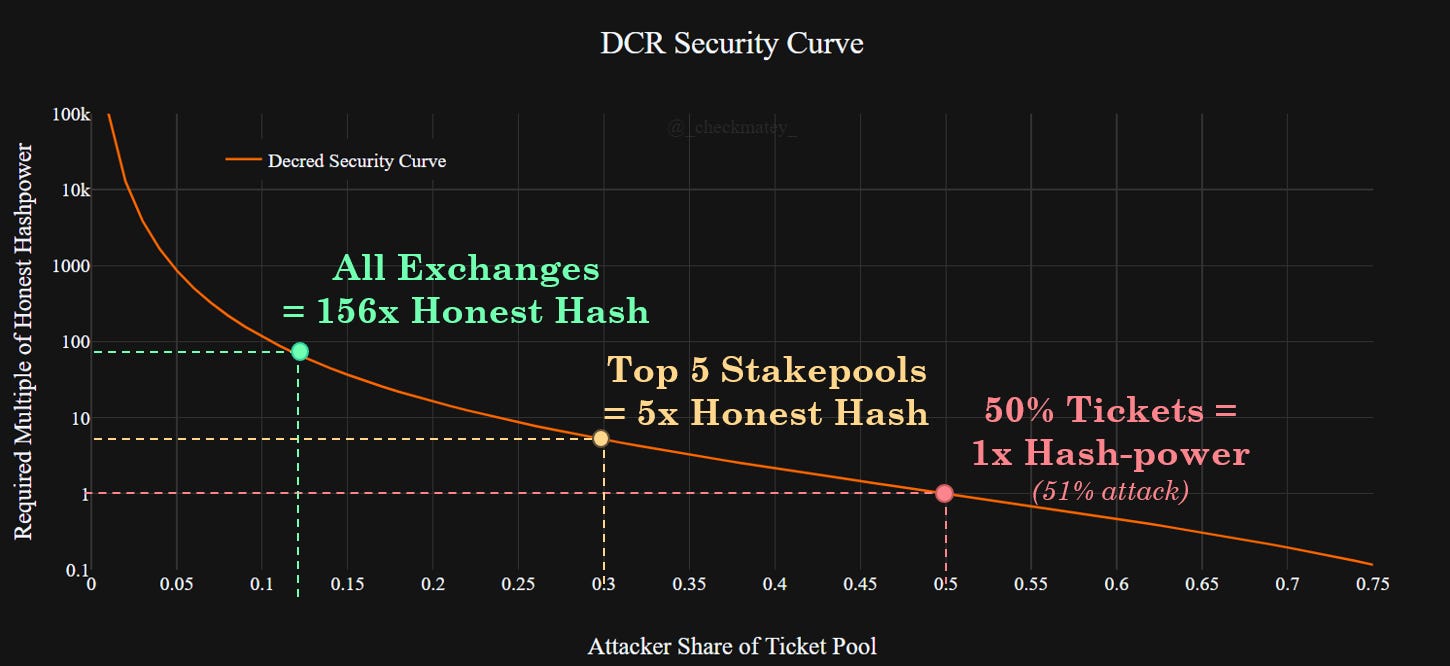
- Decred is secured by a unique Hybrid PoW/PoS consensus mechanism. Each block must be PoW mined, followed by validation by 3 out of 5 pseudo-random PoS tickets. If validation fails, blocks must be re-mined, forfeiting PoW expenditure and the block reward. The chart below presents the relative magnitude of honest hash-power to successfully double spend DCR for a given share of the ticket pool (Y-axis value of 1.0 equates to a standard 51% attack with added cost of holding 50% of tickets).
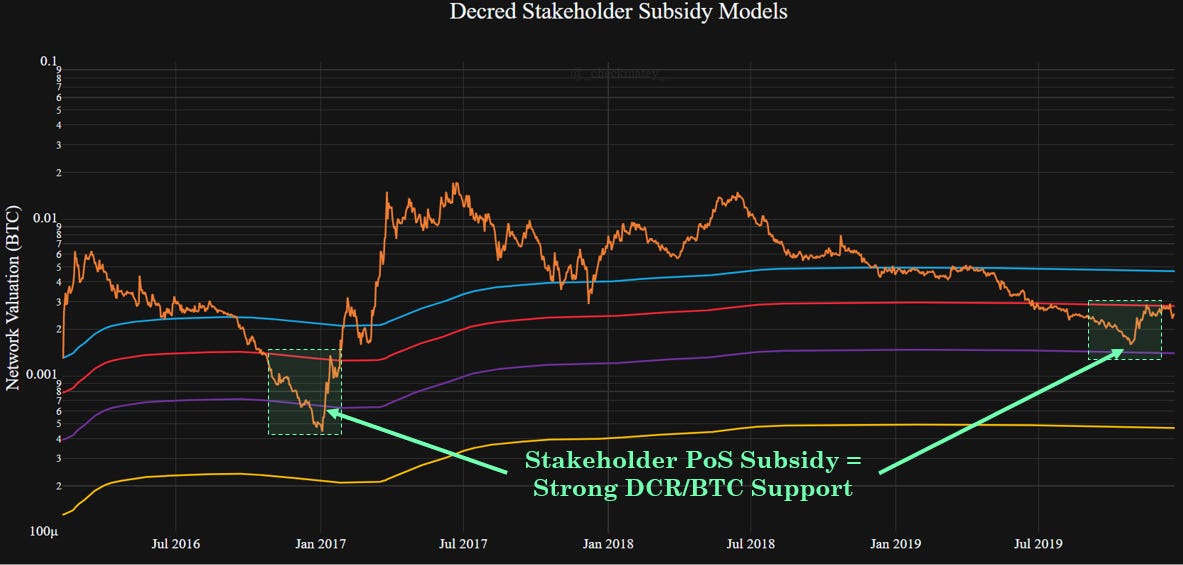
- The Decred block reward is split 60/30/10 to PoW/PoS/Treasury. Considered with the hybrid consensus mechanism, Decred functions as a high assurance, triple-entry accounting ledger. @PermabullNino released a paper studying these cumulative 'cash flows' revealing strong trend support for the DCR/BTC Price and the investor PoS break-even point (purple).
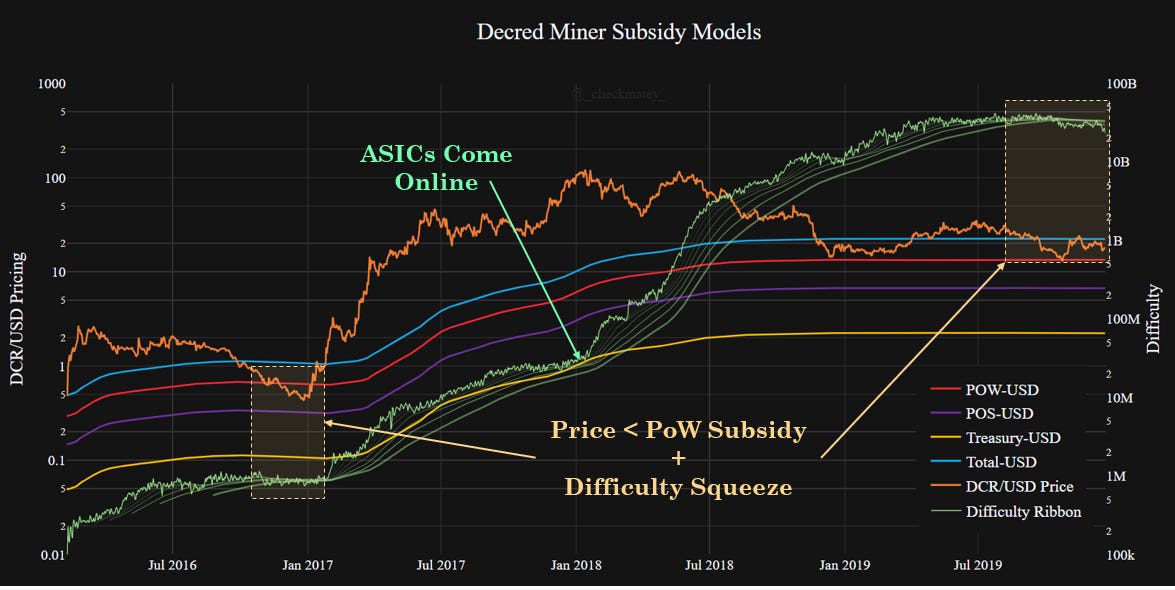
- Similarly, block subsidy models priced in USD are more representative of Miner behavior as Decred is an ASIC dominated chain. The PoW subsidy line (red) thus indicates when miner profitability is being tested. This was recently confirmed by a squeeze in the difficulty ribbon followed by a 100% price bounce.
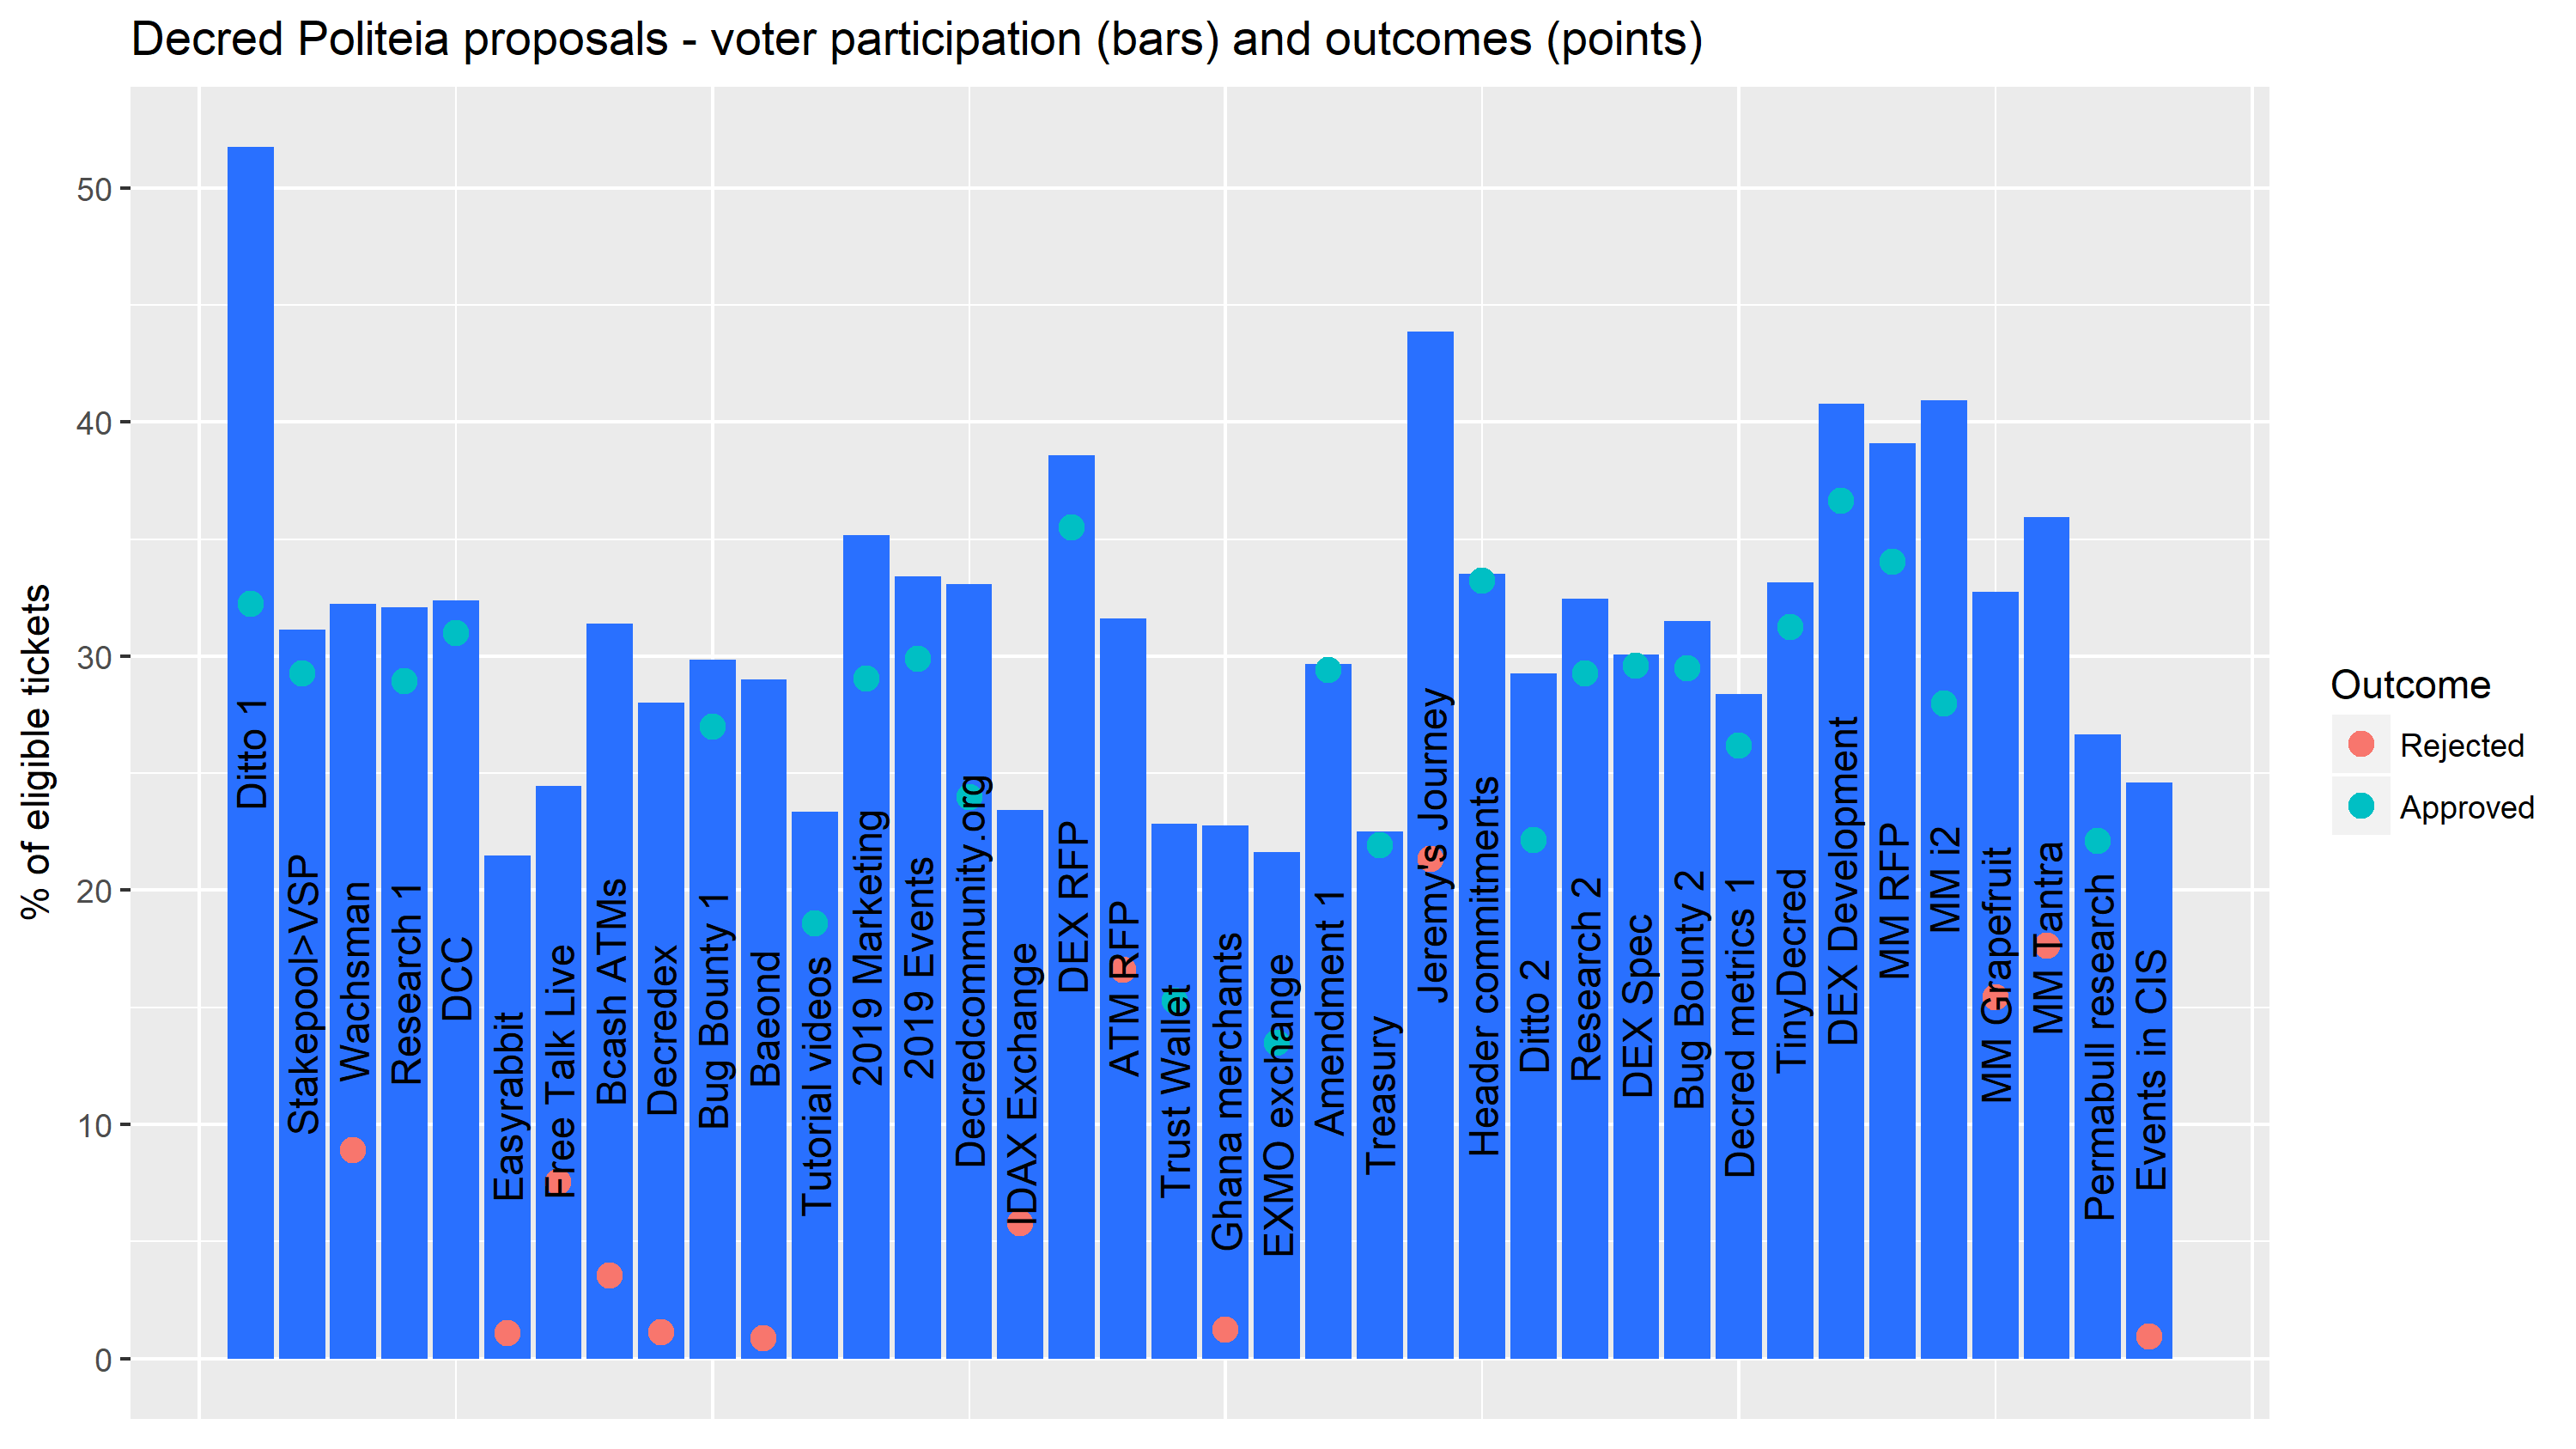
- Politeia marked a year of use in October, with 38 proposals put to a vote, 25 approved and 13 rejected. 13 of the 25 approved proposals had overwhelming (90%+) stakeholder support. The average participation rate of eligible tickets was 31.2%, the highest voter turnout was 52% and the lowest was 21% (just above the 20% quorum requirement).
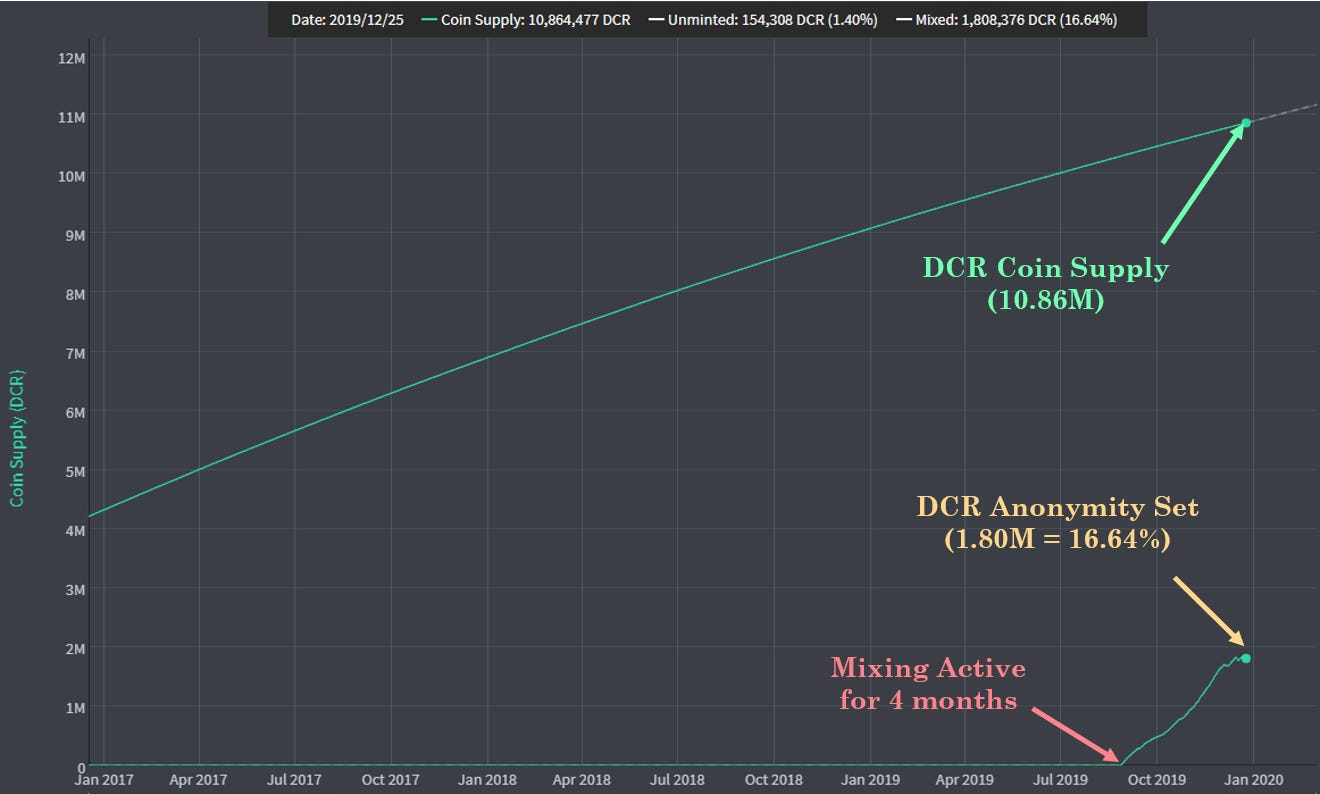
- Decred rolled out the first phase of its privacy implementation based on CoinShuffle++ and integrated with the PoS ticket system. This capitalizes on a constantly rotating and pseudo-random supply of DCR. In the four months since launch, over 16% of the DCR supply (1.8M) has participated in mixing creating a large anonymity set.
Contributor: Alexander Eichhorn, Founder at Blockwatch Data
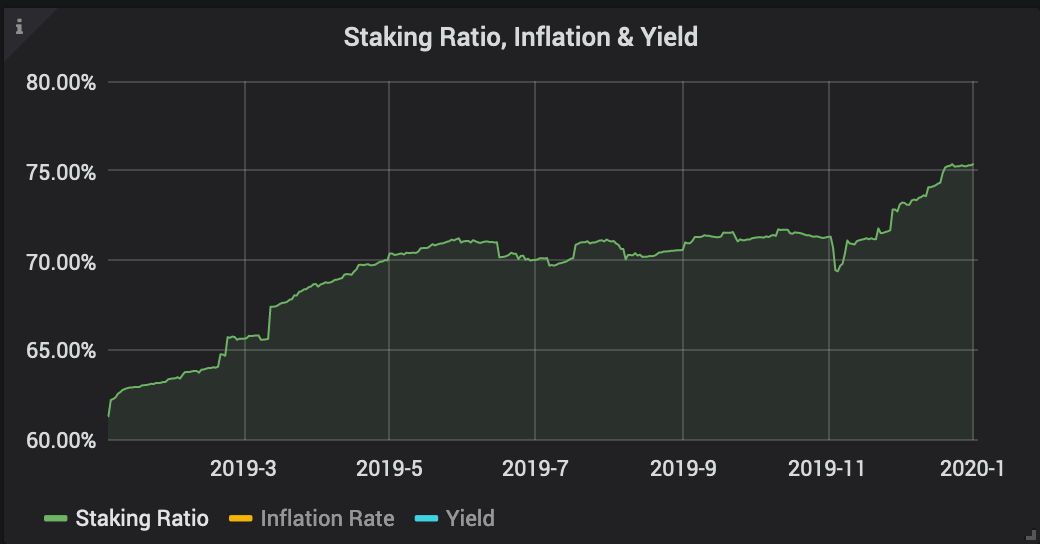
- Staking: Custodial staking is on the rise in Tezos. Since Coinbase opened their staking service in early November, the network-wide staking ratio increased by 9% to 75.4% (619M) and yield above inflation decreased to 1.65%. Already 4/20 top bakers are exchanges, with Coinbase being the largest (36.4M).
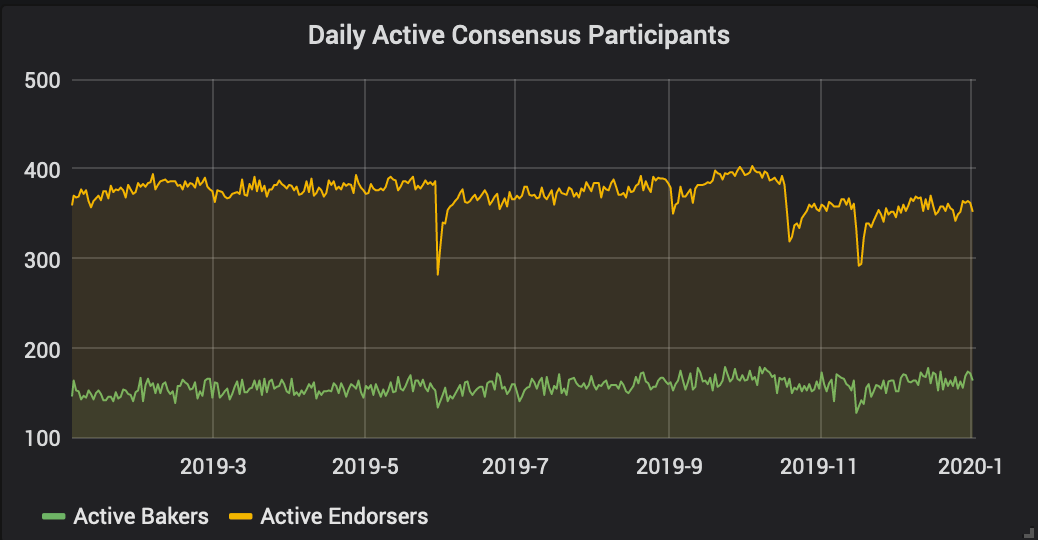
- Upgrades: 80% of Tezos validators upgrade their software on time for new protocols activations or emergency fixes and 10% follow within a week. There is a visible churn of 10% hinting at a growing upgrade fatigue. With 430 distinct validators, Tezos still has one of the most distributed consensus systems in the blockchain space.
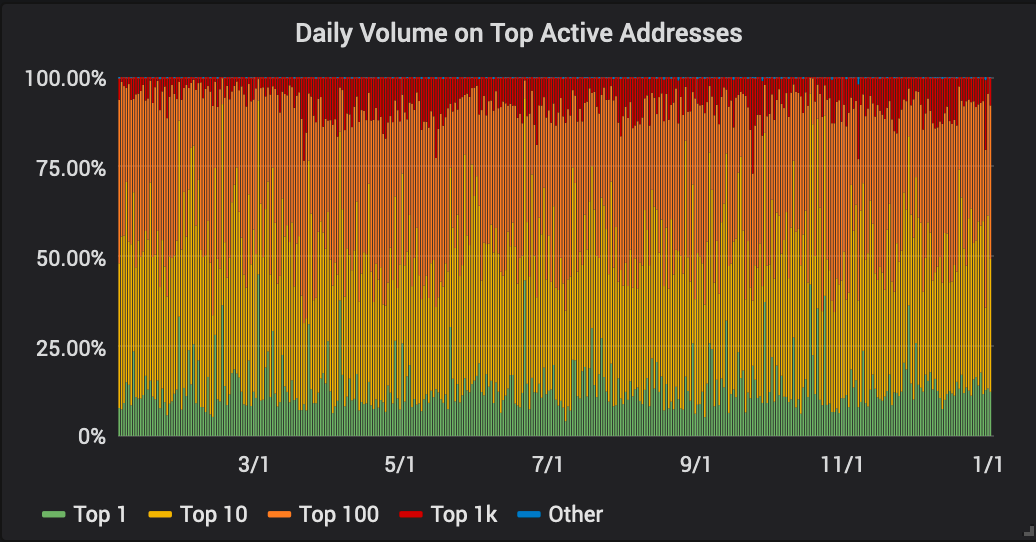
- Volume: Transaction volume on Tezos is pretty much centralized around 100 addresses with the top 10 addresses amounting to at least 50% of all transacted coins. This suggests the network has not yet left the stage where staking payouts and speculation are major use-cases.
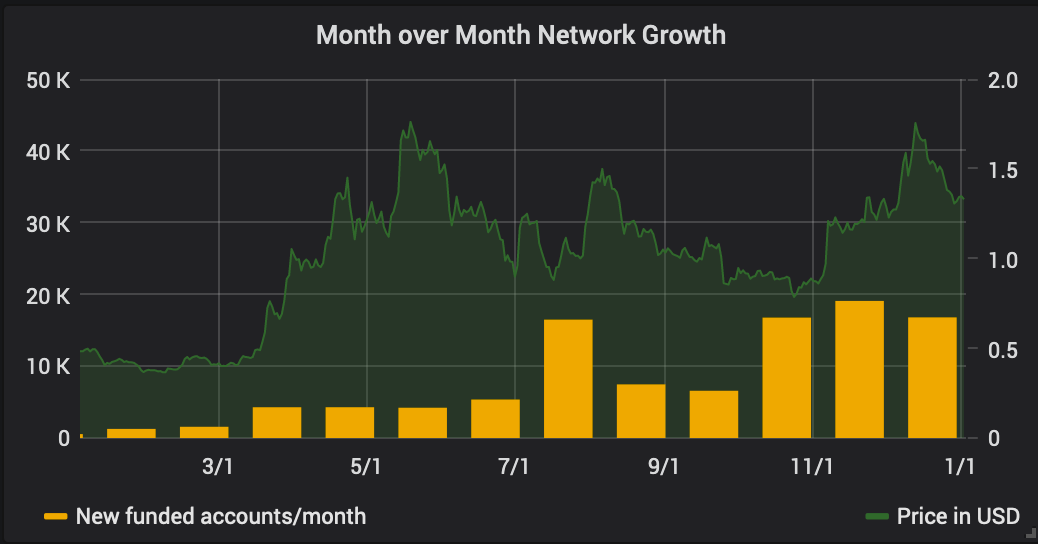
- Growth: Fueled by interest in staking services and arbitrage opportunities Tezos' growth in terms of newly funded addresses has been accelerating to new peaks between 15-17k per month from Oct to Dec '19. However, out of 353k total funded addresses only 23.7k addresses hold more than 100tz ($125), up 10% over the last 3 months. In relation, Bitcoin's monthly growth rate is 20x higher.
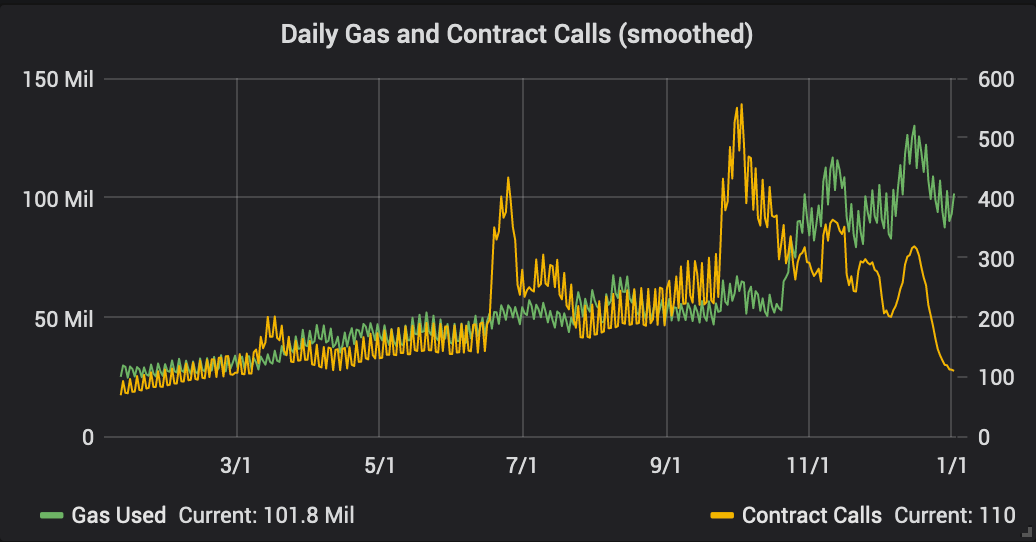
- Adoption: Despite it's benefits as smart-contract platform, Tezos has not yet seen widespread adoption even though the number of deployed contracts has increased 2.1x to 230 after the recent Babylon protocol upgrade and daily gas usage has doubled. Still, usage of smart contracts is stagnant which may be because most of the interesting use-cases are still in development.
Our Network is a weekly newsletter where top blockchain projects and their communities share data-driven insights. Subscribe now to receive a crash course in on-chain metrics and crypto fundamentals, and never miss an issue.
About the editor: Spencer Noon leads investments for DTC Capital, a fundamentals-focused crypto fund. He actively tweets about on-chain metrics.