ON–020: DeFi
May 8, 2020

Interested in discussing on-chain metrics? Click here to join the Our Network telegram chat. Welcome to Issue #20 of Our Network, the newsletter about on-chain metrics and crypto analytics that reaches almost 2000 investors every week.
This week our contributor analysts cover DeFi:
- Aave
- Balancer 🆕
- Compound
- Set Protocol
Contributor: Isa Kivlighan, Aave team
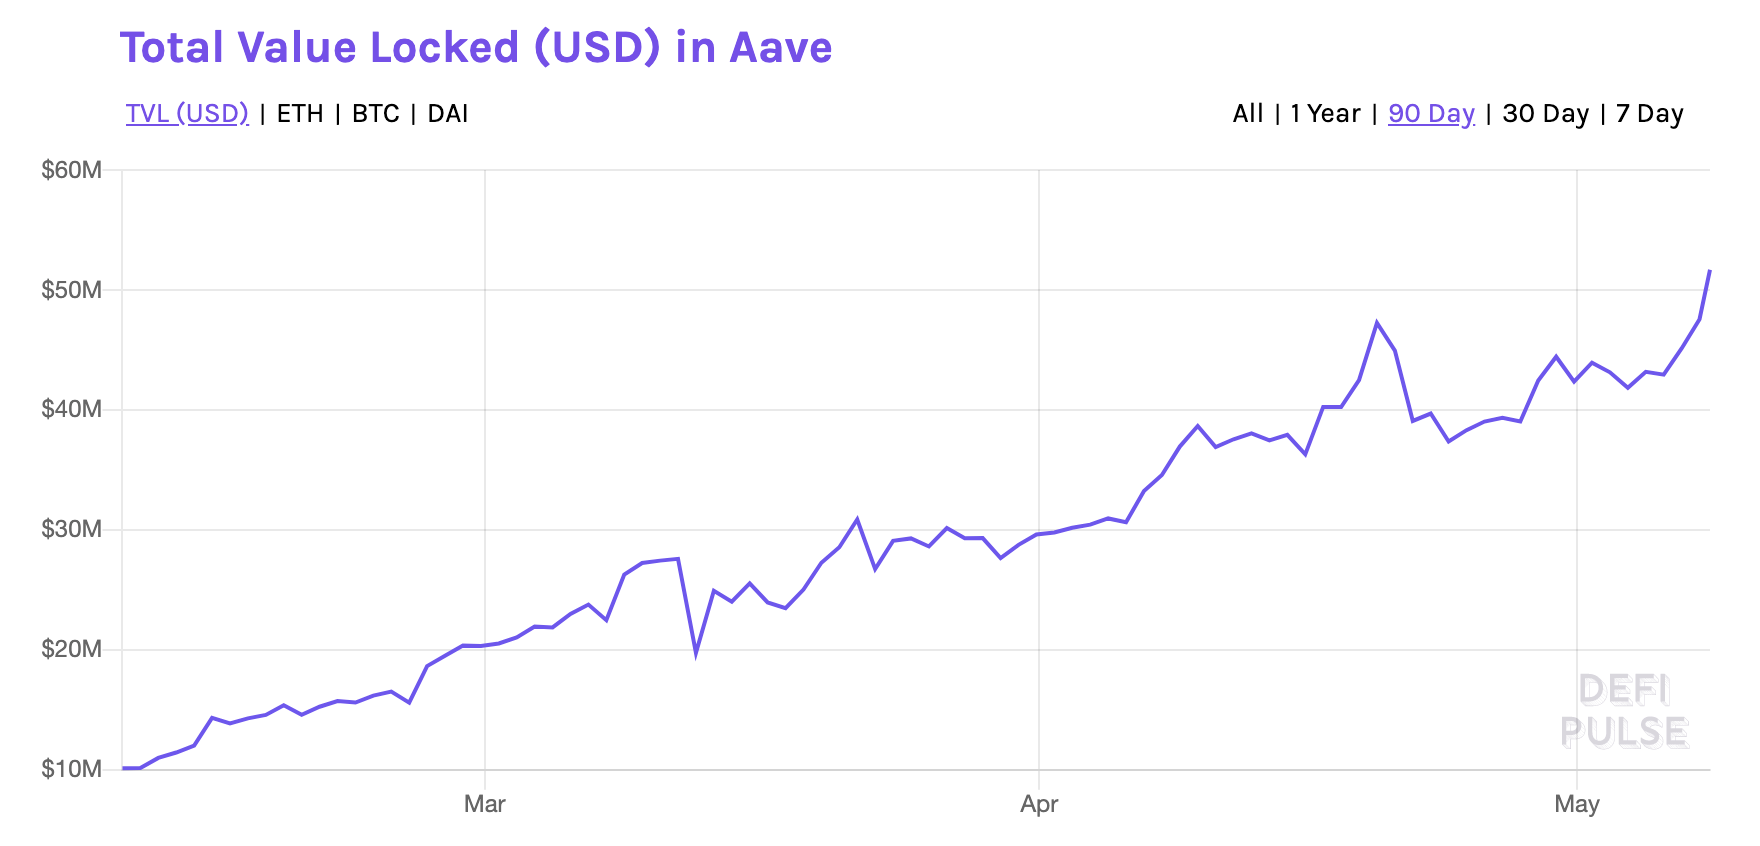
- Aave has experienced remarkable growth since its mainnet launch in January. This dashboard shows Aave’s current market size ($63.5M), total amount borrowed ($11.3m), and TVL ($52.2m) of the protocol. TVL ranks #4 overall among DeFi projects on DeFi Pulse.
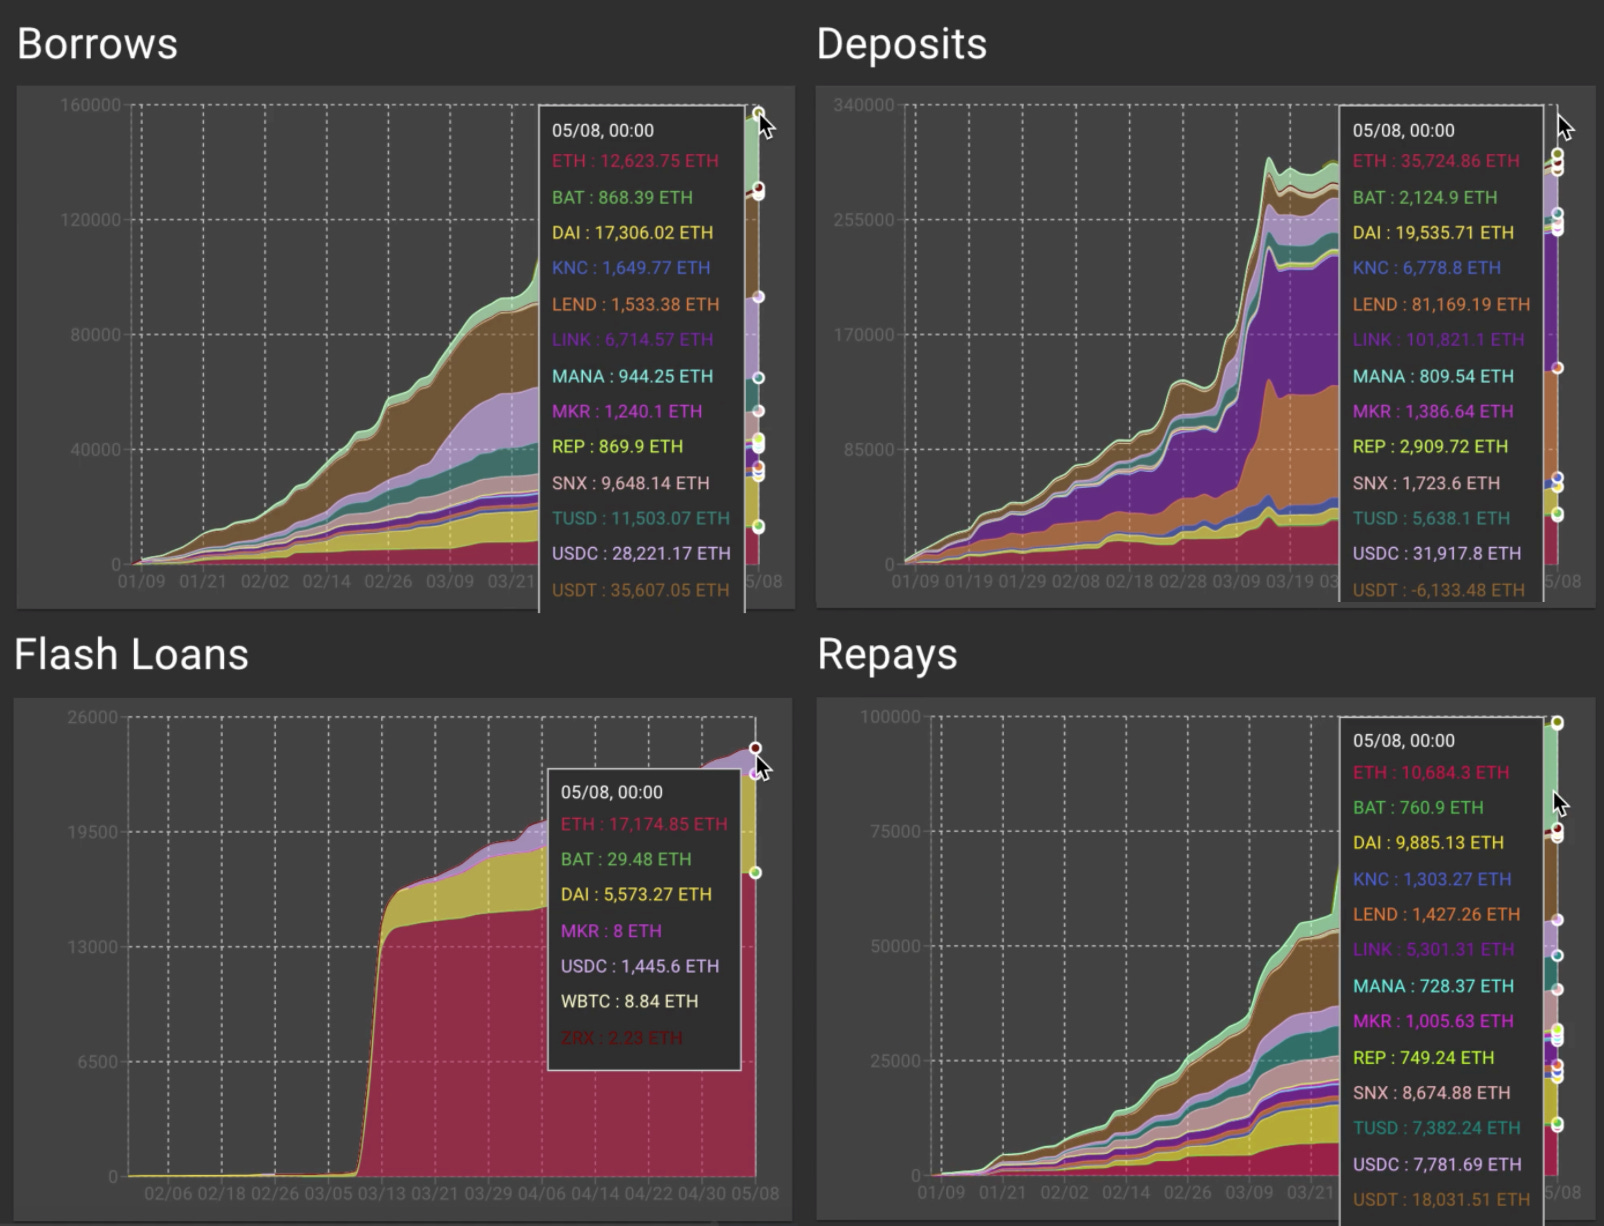
- For a more granular picture of historical activity, Aave Watch provides a breakdown of deposits, borrows, repayments, and flash loans since Aave’s mainnet launch:
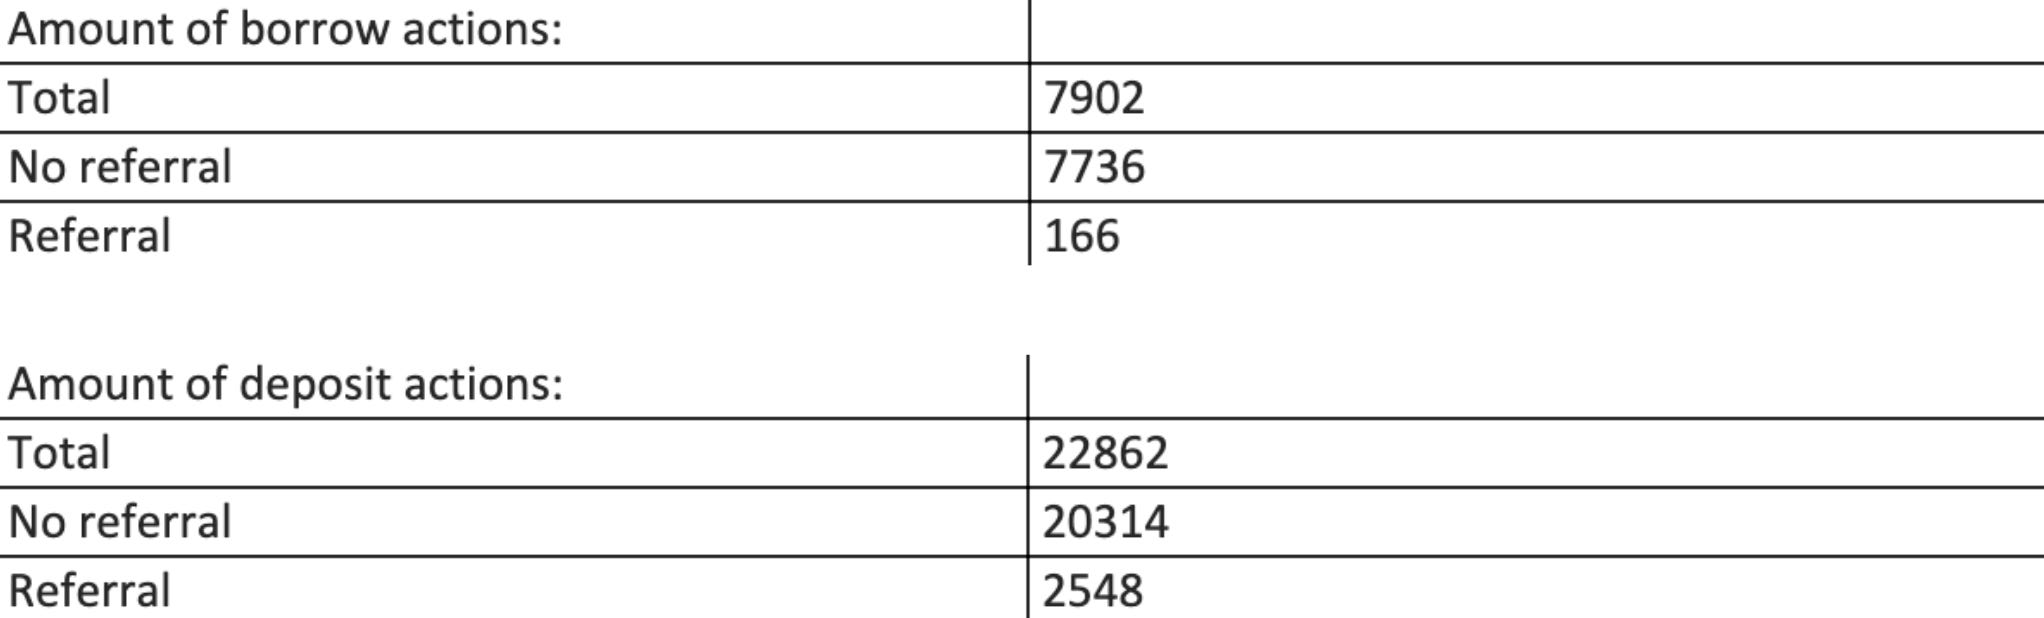
- One metric that Aave tracks is 3rd party referrals driving users to the protocol. Here we can see a breakdown of cumulative referral activity for deposits and borrows:
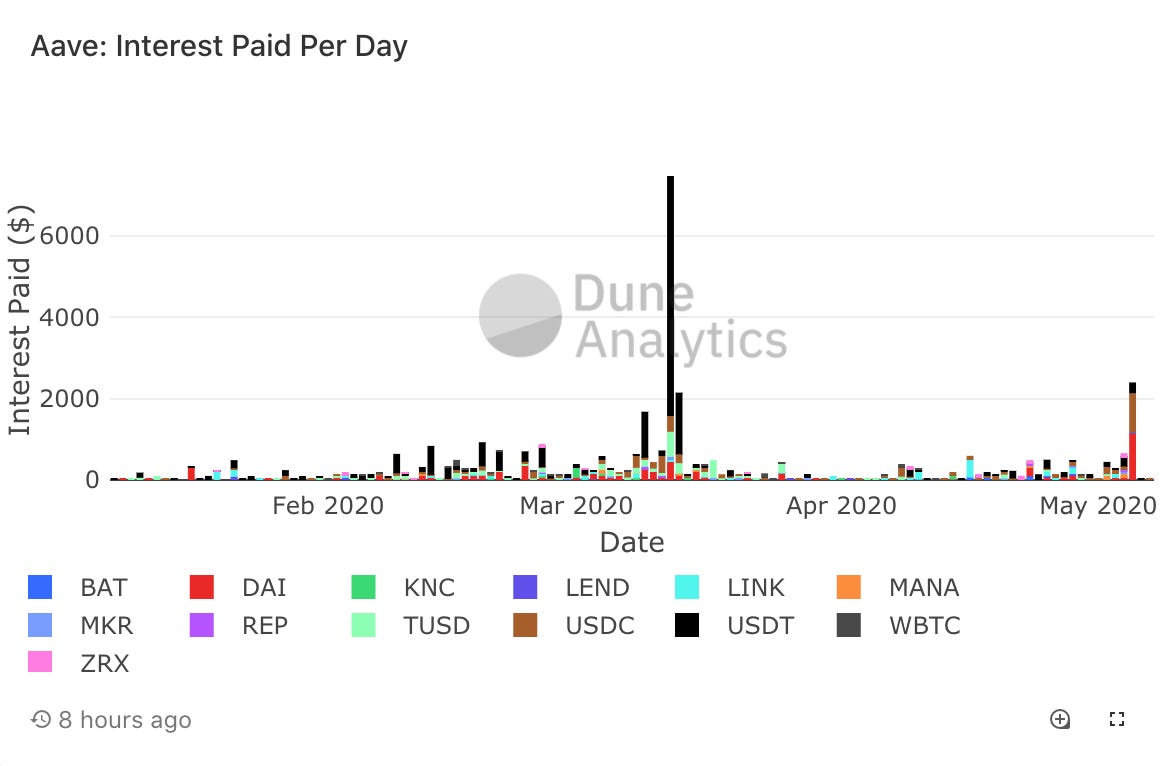
- This Dune Analytics dashboard created by Matteo Leibowitz shows the amount of interest paid per day broken down into each asset on Aave:
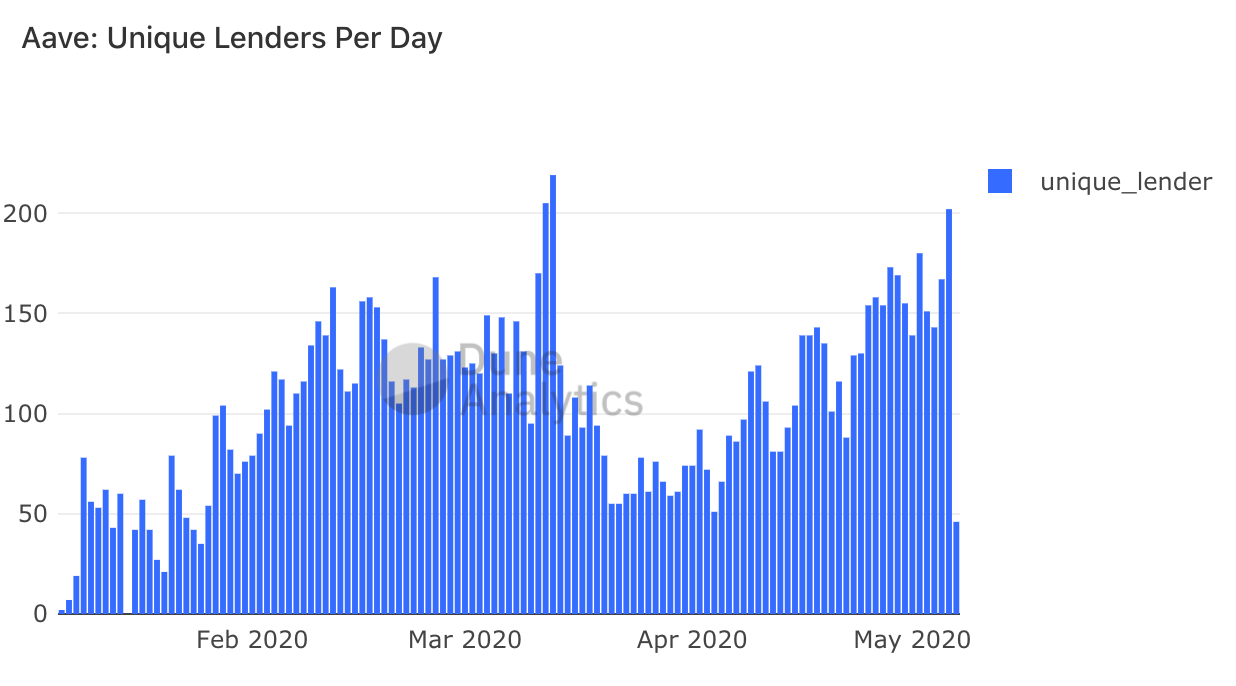
- Here we can see the number of unique lenders per day since Aave Protocol went live. The daily all-time high occurred on March 13th with 219 unique lenders, but as we can see, that milestone is close to becoming eclipsed (source - dashboard created by Matteo Leibowitz).
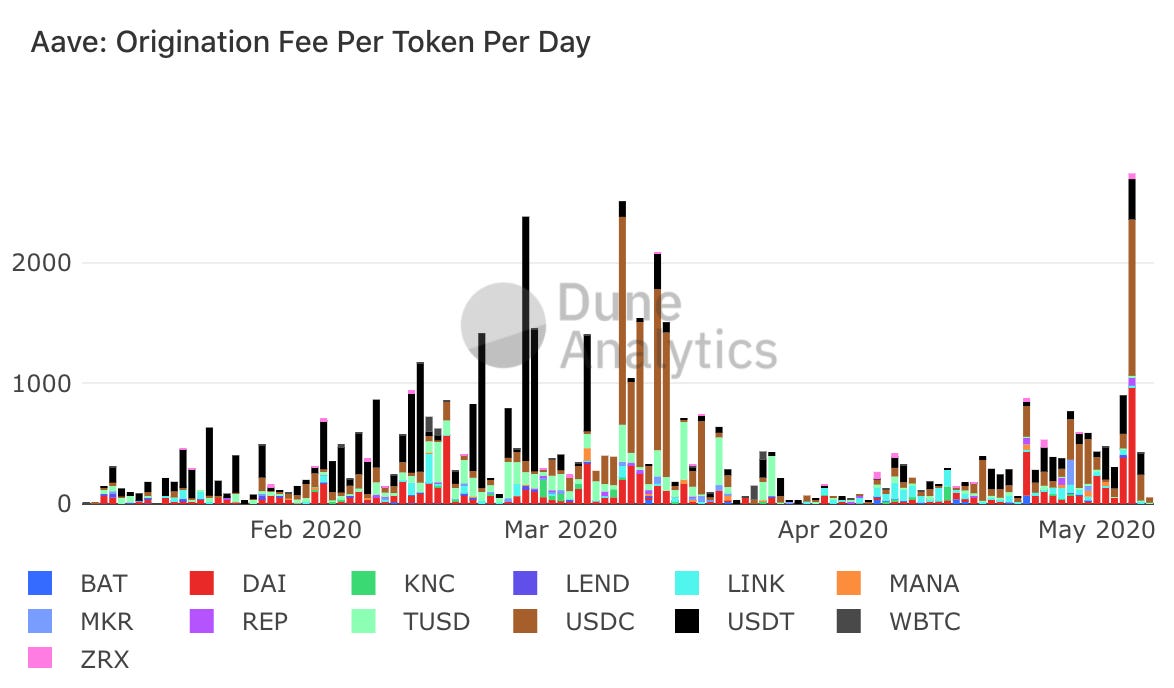
- Lastly, let’s take a look at protocol fees. The graph below shows the daily net origination fee per token. An origination of 0.25% of the loan amount is taken from every borrow transaction. Out of that 0.25% origination fee, 80% is taken to buy and burn LEND, decreasing the monetary supply of the LEND token (source - dashboard created by Matteo Leibowitz). Note: This chart does not take into account the Flash Loan fee of 0.09% .
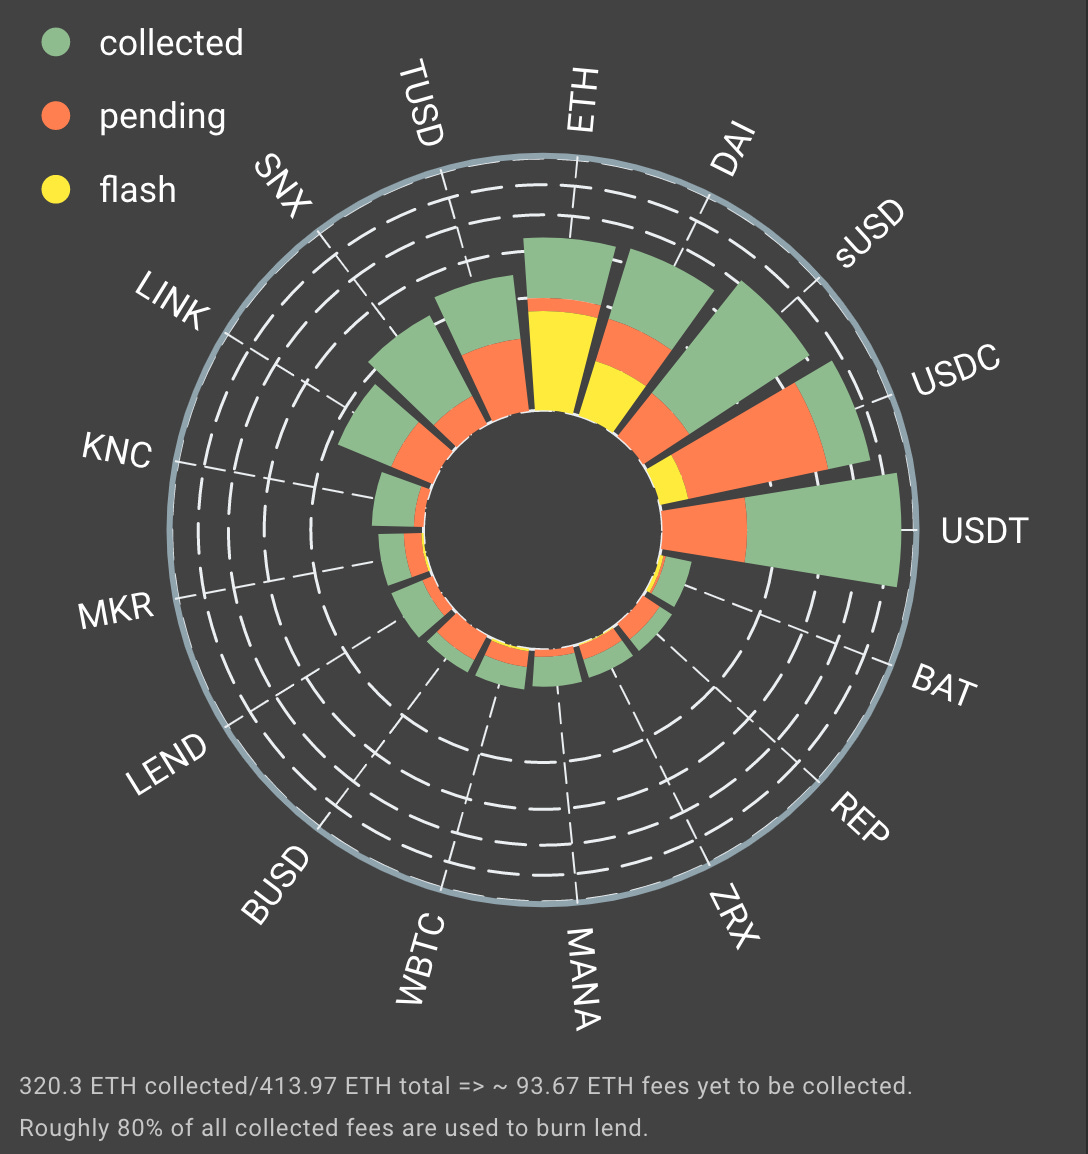
Aave Watch also has a breakdown of the fees by asset which shows how much has been collected, how much is yet to be collected, and how much comes from Flash Loans. A 0.09% fee is collected from every Flash Loan. 70% of this fee goes to reward depositors, and the remaining 30% is split 80/20, with the 20% from that going to 3rd party integrators/referrals (source).
As you can see, the majority of flash loans occur using ETH, DAI, and USDC, while USDC and sUSD have collected the largest share of fees on Aave.
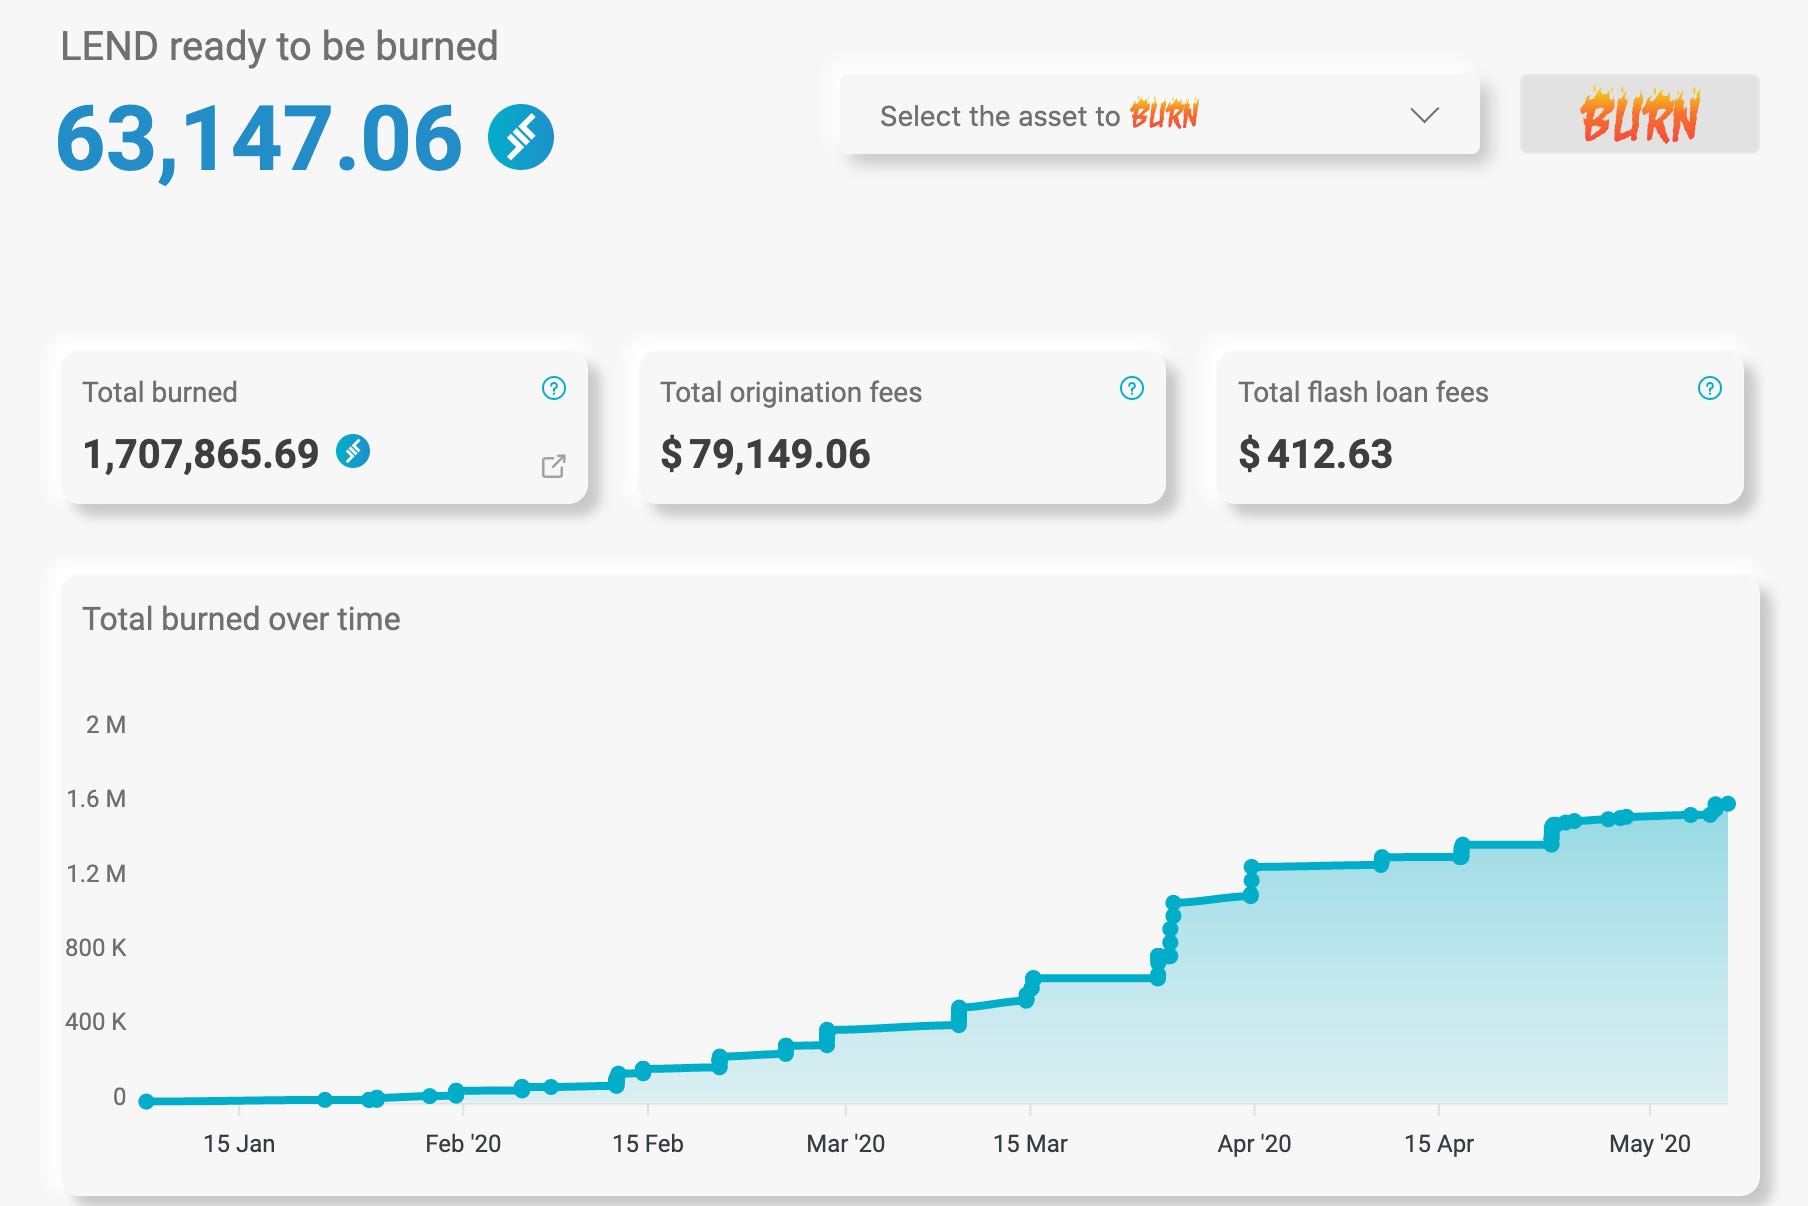
- Finally, data from our token burn page shows how much LEND is ready to be burned, how much has already been burned, and how much comes from origination fees and Flash Loan fees. As expected, the total LEND burned over time is steadily increasing.
Contributor: Fernando Martinelli, Co-founder & CEO at Balancer Labs
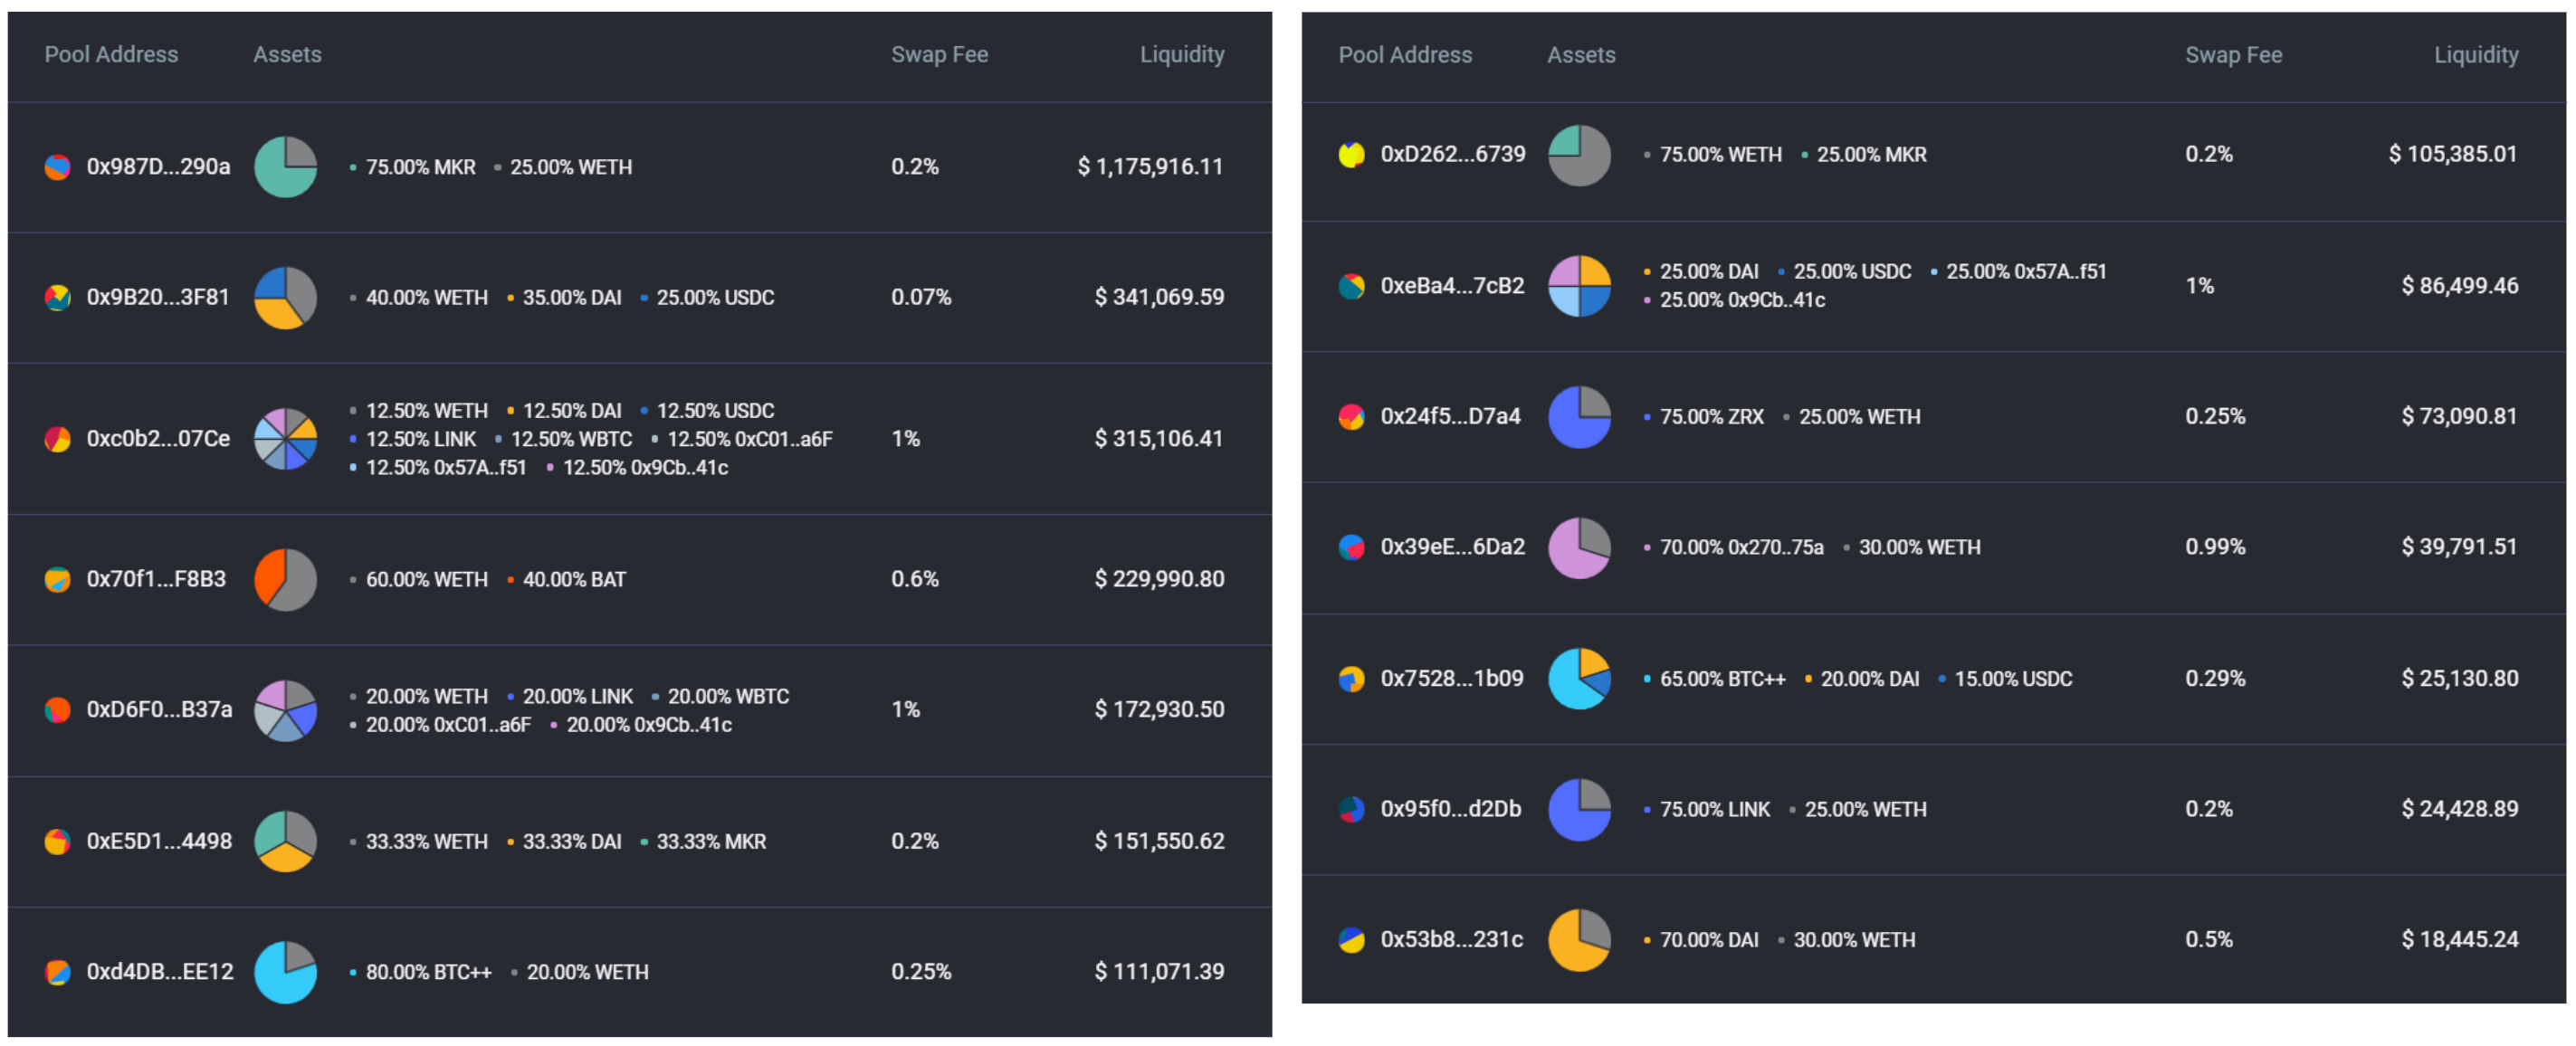
- Launched on the last day of Q1, Balancer has already surpassed $2.5M in liquidity provisioned to its pools. Balancer is a generalized AMM (Automated Market Maker) that enables a wide variety of configurations: up to 8 tokens per pool, distributed in any proportions (aka weights) of the pool’s total value, and any custom trading fee. The configurations of the pools created so far reveal users have been extensively experimenting with the protocol’s flexibility. As can be observed below, there’s great pool diversity (source).
- Inspecting the aggregate liquidity per asset across all pools, we see below that Balancer has attracted its first MKR whales (source - query created by Matteo Leibowitz). A plausible hypothesis is that pools with uneven weights (as is the case with the “75% MKR & 25% ETH” pool) can maximize the ability of opinionated portfolios in providing liquidity. These pools are compelling enough (desired exposure is maintained; lower ETH requirement; less impermanent loss) that previously dormant portfolios may finally decide to join the AMM arena. As a point of reference, within just one month since launch the 2.77k MKR on Balancer pools already account for 41% of the 6.69k MKR yup currently on Uniswap. Further analyses and simulations around uneven pools are explored here.
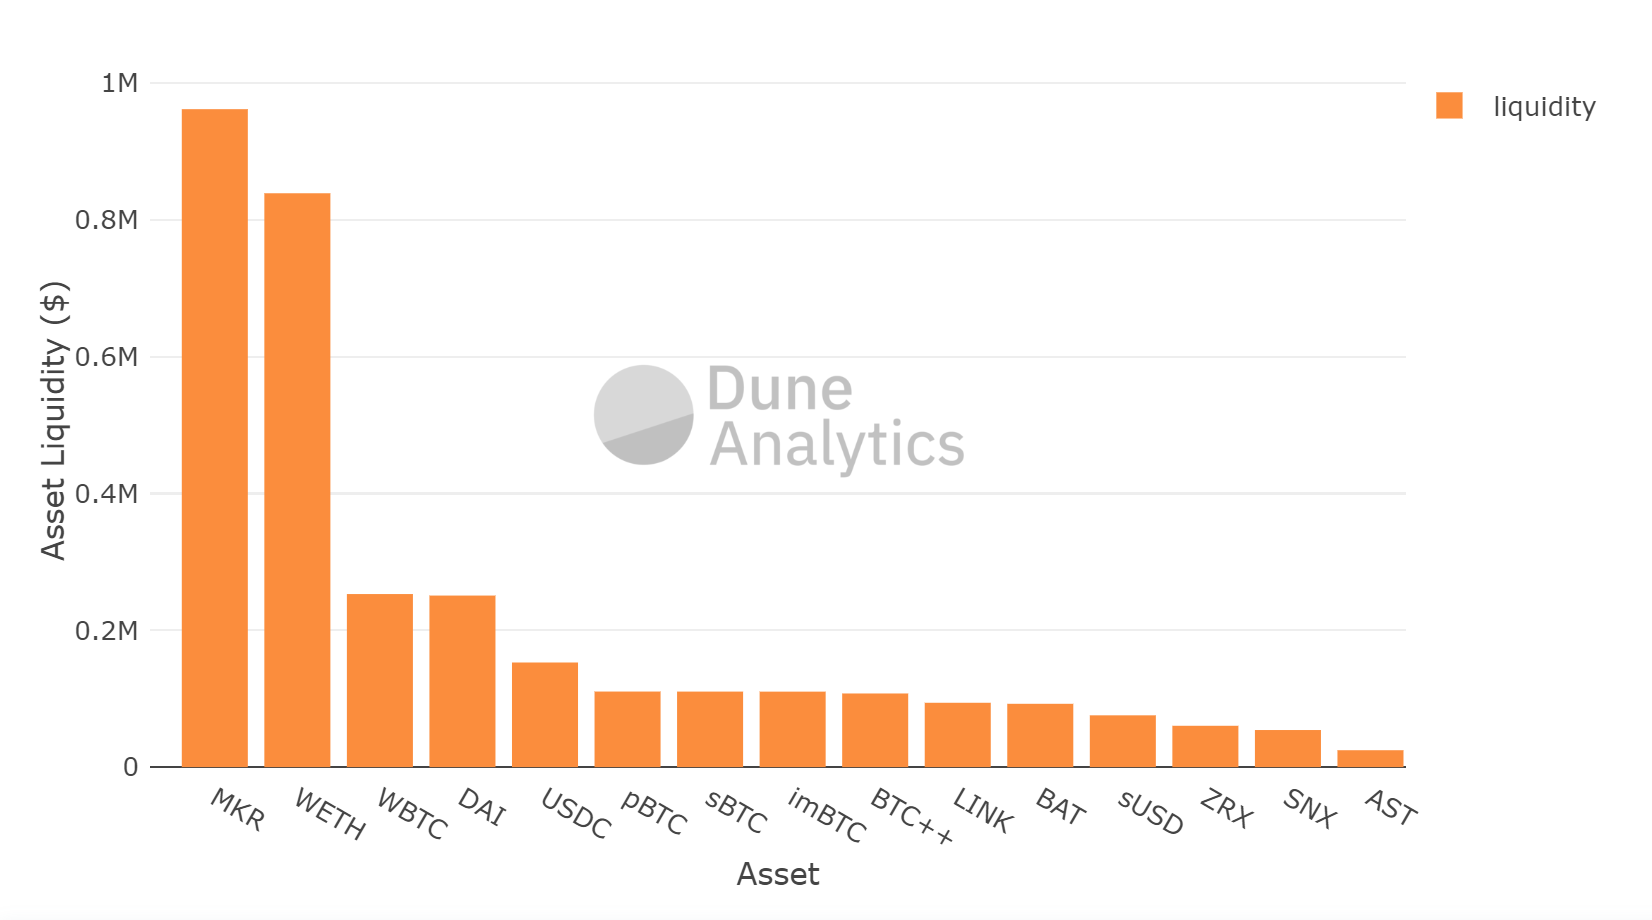
- Another observation from the graph above is that tokenized BTC on Ethereum has shown a meaningful presence with some of its available flavors. This is mainly due to PieDAO’s BTC++, a Balancer pool comprised of BTC-pegged tokens that is managed by a DAO and showcases the Balancer protocol as a powerful building block in DeFi. BTC++ holders benefit from a proactive management of the pool, diversified risk and the revenue generated from trading fees between the underlying assets. The supply of BTC++ is around $450k and has been growing rapidly since a recent code audit by Quantstamp has been concluded. Other future Pies (PieDAO’s tokenized portfolios) such as USD++ are also expected to leverage Balancer, attracting further liquidity into the protocol (source 1, 2).
The use of AMMs for initial token listing was recently pioneered by UMA. While Uniswap as the chosen platform felt familiar to most Ethereum users, Balancer’s LBPs (Liquidity Bootstrapping Pools) could have arguably achieved a broader token distribution under a more inclusive and organized process.
An LBP could start at 80/20 weights (80% project_token & 20% ETH) and gradually turn into a 50/50 pool over the course of a week (or any other desired period). With such parameters, the token ends up 4x cheaper (a 75% discount) than its initial price, so the team can set a very high starting price (no FOMO) and let the token slowly devalue, similarly to a reverse auction. Participants may buy the token at any point in time (whenever they individually find the price attractive), effectively counteracting the downtrend and hence contributing to a much smoother price discovery process. Whales are still welcome, but not at the expense of excluding retail users. More about LBP mechanics and possible configurations are explored in this blog post.
Contributor: Lucas Campbell, Growth & Research at DeFi Rate
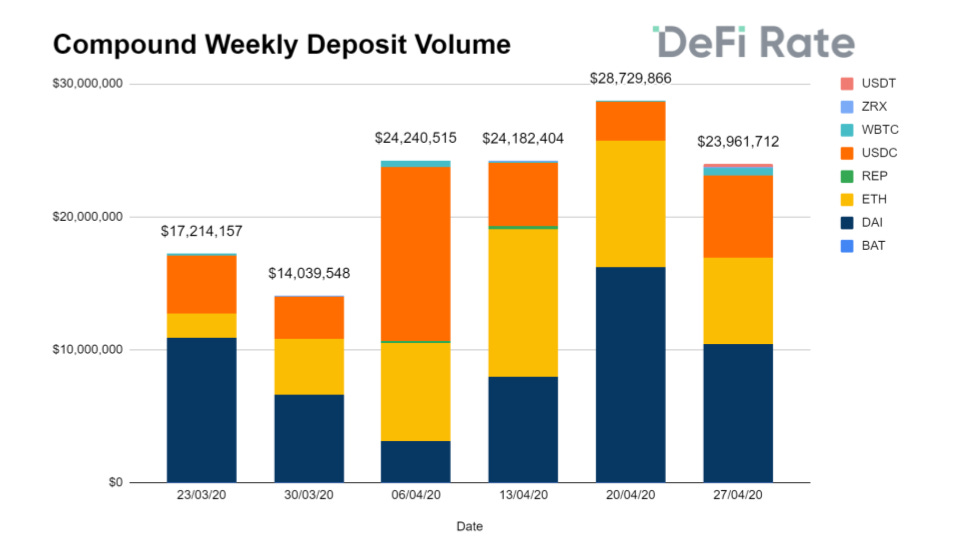
- In the past 6 weeks, Compound has experienced over $140M in cumulative deposit volume - averaging roughly $20M per week. The most notable contributors to these volumes are DAI, ETH, and USDC, which account for approximately 98% of all deposits to the money markets protocol. Leading deposit volumes is Dai, aggregating ~$56M in total deposits in the past six weeks. This is followed by ETH and USDC which represent for $42.8M and $38.2M in cumulative volumes, respectively. The next closest asset is WBTC which totaled for $1.3M. Lastly, USDT was added as a supported asset in late April. In its first two weeks, the fiat-backed stablecoin has accumulated nearly $600,000 in total deposits.
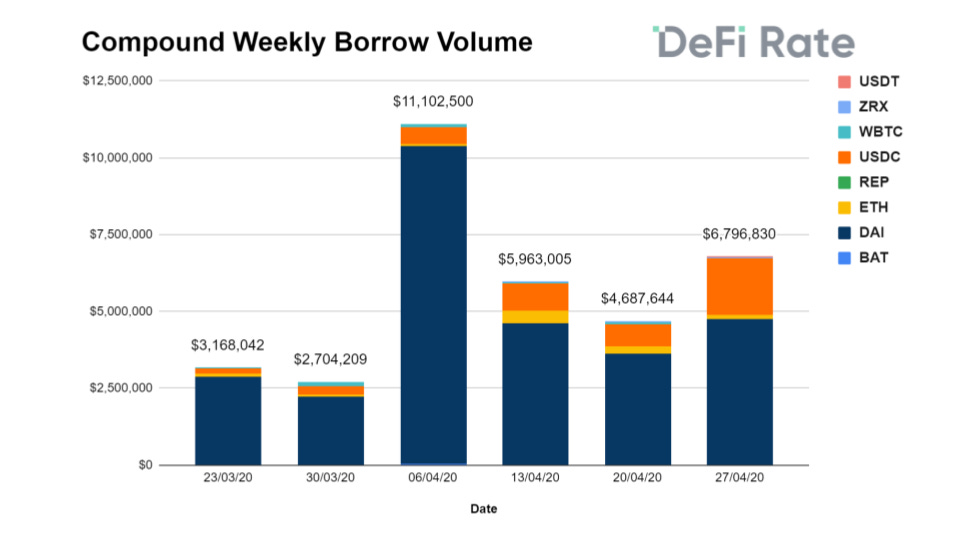
- Looking at borrowing activity, Compound aggregated around $36M in total volume over the past six weeks, averaging ~$5.2M per week. Borrowing volumes are dominated by Dai as the crypto-native stablecoin has accounted for ~80% of all borrowing activity in the past six weeks. The next closest contributor is USDC which accumulated over $5M in total volume or around 13% of cumulative borrows. ETH is the only other asset on the protocol aggregating seven figures in borrowing activity, reaching $1.1M in volume since late March. WBTC was close behind with $818K while all other assets (BAT, REP, ZRX) totaled for ~$121K in volume. Lastly, USDT has averaged $72.6K in borrowing activity in its first two weeks on the protocol - making it the 5th most actively borrowed asset on Compound.
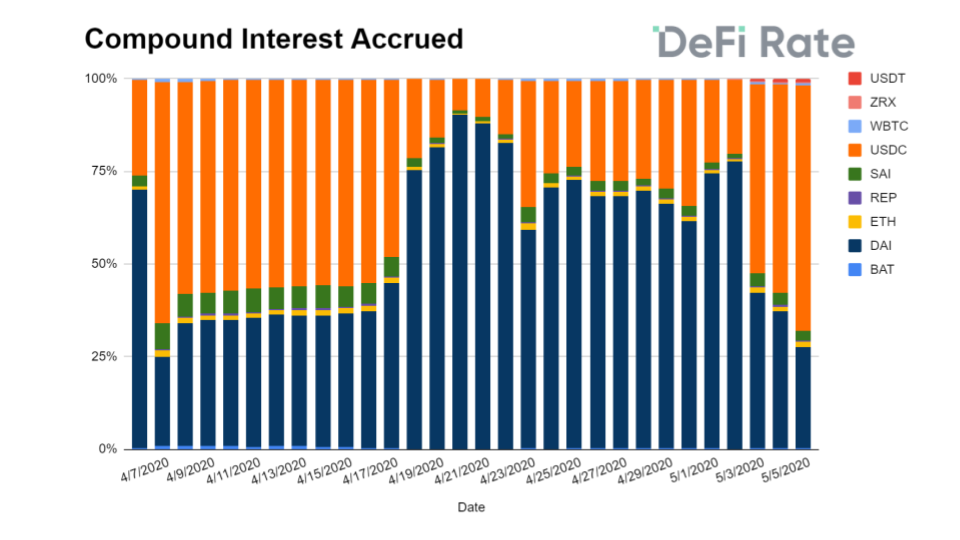
- Compound users have earned ~$61,000 in interest in the past 30 days, distributing around ~$2,000 per day to depositors. Despite the fact that interest rates are at historic lows - 1.16% APY on USDC and 0.77% APY on DAI - USDC and DAI still account for 95% of all interest accrued on Compound this month. The addition of USDT should also serve well in the coming future as Tether currently has the highest APY relative to the other stablecoins, offering 2.75% APY on deposits. What’s interesting to note is that USDC has "flippened" DAI in terms of interest accrued per day for the second time this month as USDC is now distributing ~$840 per day compared to DAI's ~$350.
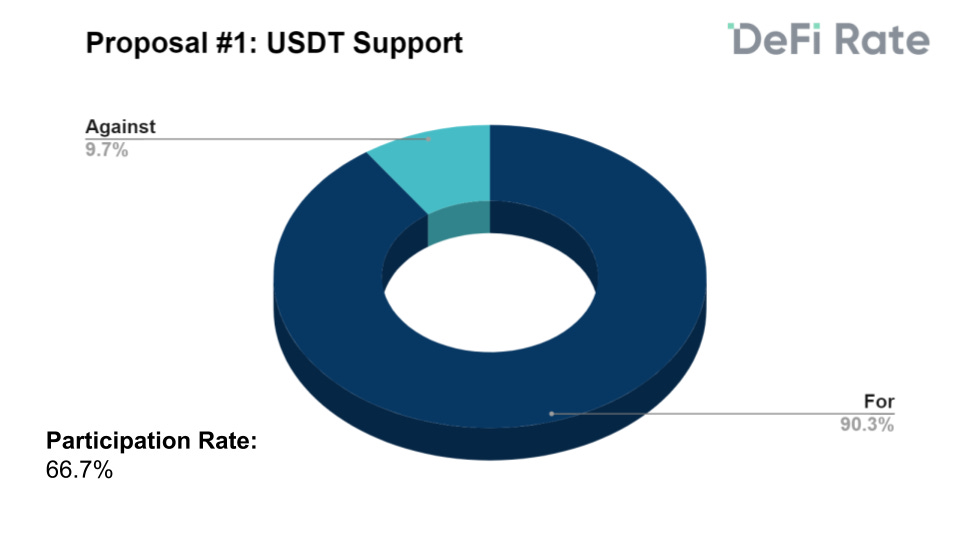
- Last week we saw the first two on-chain governance proposals go live on Compound. While COMP tokens are still restricted for public access, there are currently ~36 delegates with voting power. The first proposal was the more controversial of the two with voters ultimately electing to support USDT on the protocol. With 24 delegates weighing-in on the proposal, 90.3% voted “For” while 9.7% voted “Against”. Notable voters on the “Against” side include prominent community members Ryan Sean Adams, Ric Burton, Zerion, and DeFi Rate.
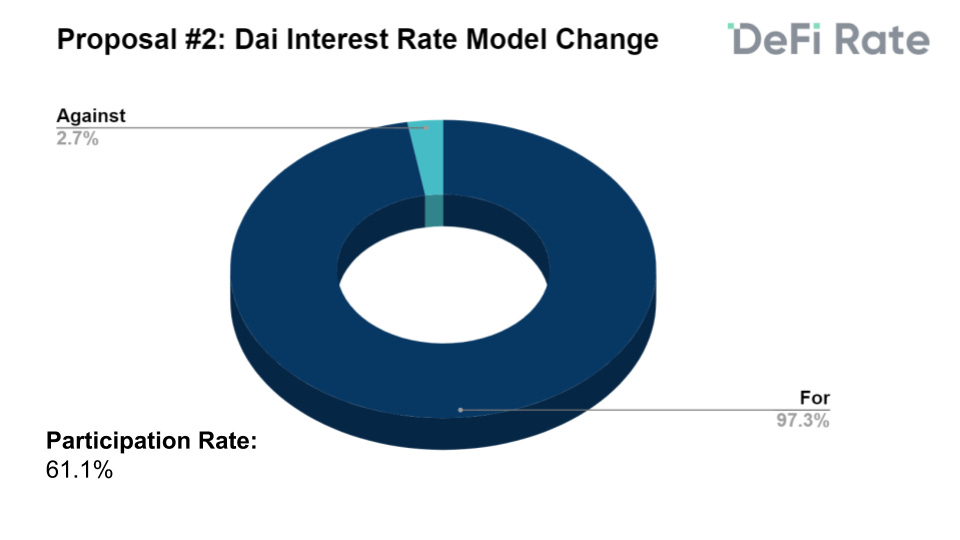
The second proposal was submitted by Dharma - a DeFi application that relies on Compound - to change the interest rate model in light of the current landscape with the Stability Fee and Dai Savings Rate (DSR) at 0%.
This proposal was less controversial than USDT as 97.29% voted “For” while 2.71% voted “Against”. IDEO CoLab Ventures was the only major delegate to vote “Against” which is cited to be due to Dharma's submission process and not the substance of the proposal itself. Expanding on this, Dharma went ahead and submitted the proposal on-chain without any discussions or signals from the community beforehand. This is generally not in line with best practices for decentralized governance and IDEO elected to vote “No” in order to highlight the importance of setting standards for long-term sustainable governance.
Contributor: Anthony Sassano, Product Marketing at Set Protocol
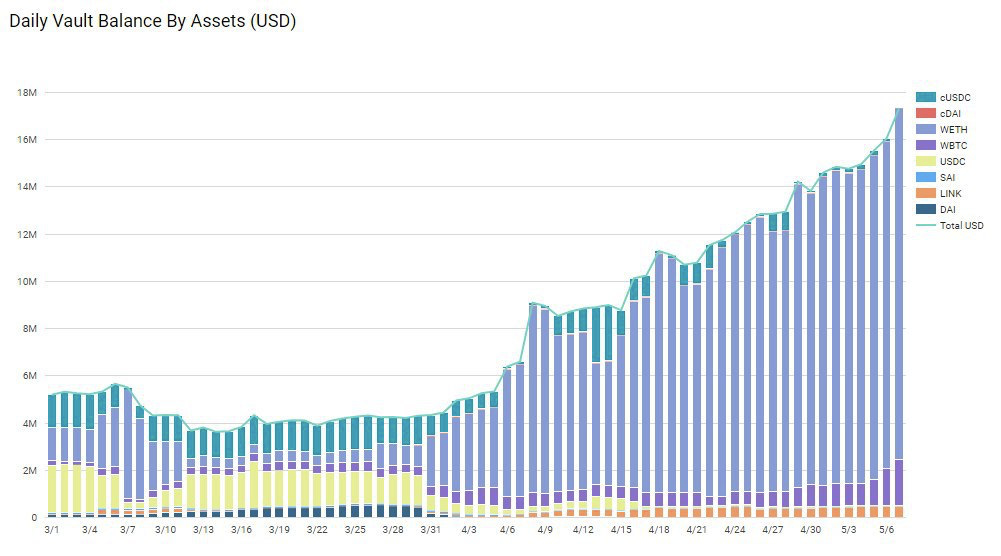
- This new graph on our Scout dashboard shows the overall sentiment of both Robo Sets and Social Trading Sets on the TokenSets platform. You can see that during March, the majority of the Sets were bearish (holding USDC and cUSDC) whereas during April, they started flipping bullish and quickly reallocated. Today, the majority of the collateral in the Set Protocol Vault is WETH, WBTC and LINK which points to an extremely bullish sentiment for those 3 assets.
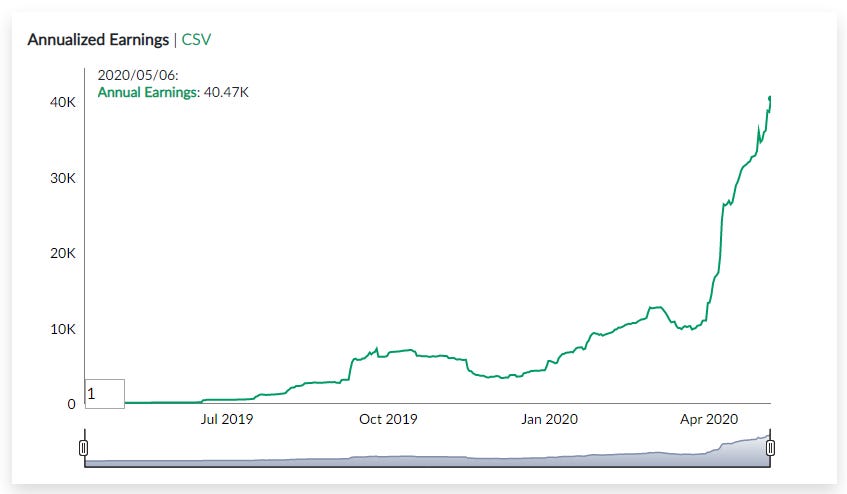
- In early April, we relaunched the majority of the Social Trading Sets because we added the ability for traders to set performance fees and streaming fees. Since then, Set Protocol's annualized earnings has exploded with it now sitting at $43,000 after just 5 weeks worth of performance and streaming fee accrual for traders. We expect this growth to continue as traders build out more performance and get additional inflow into their Sets.
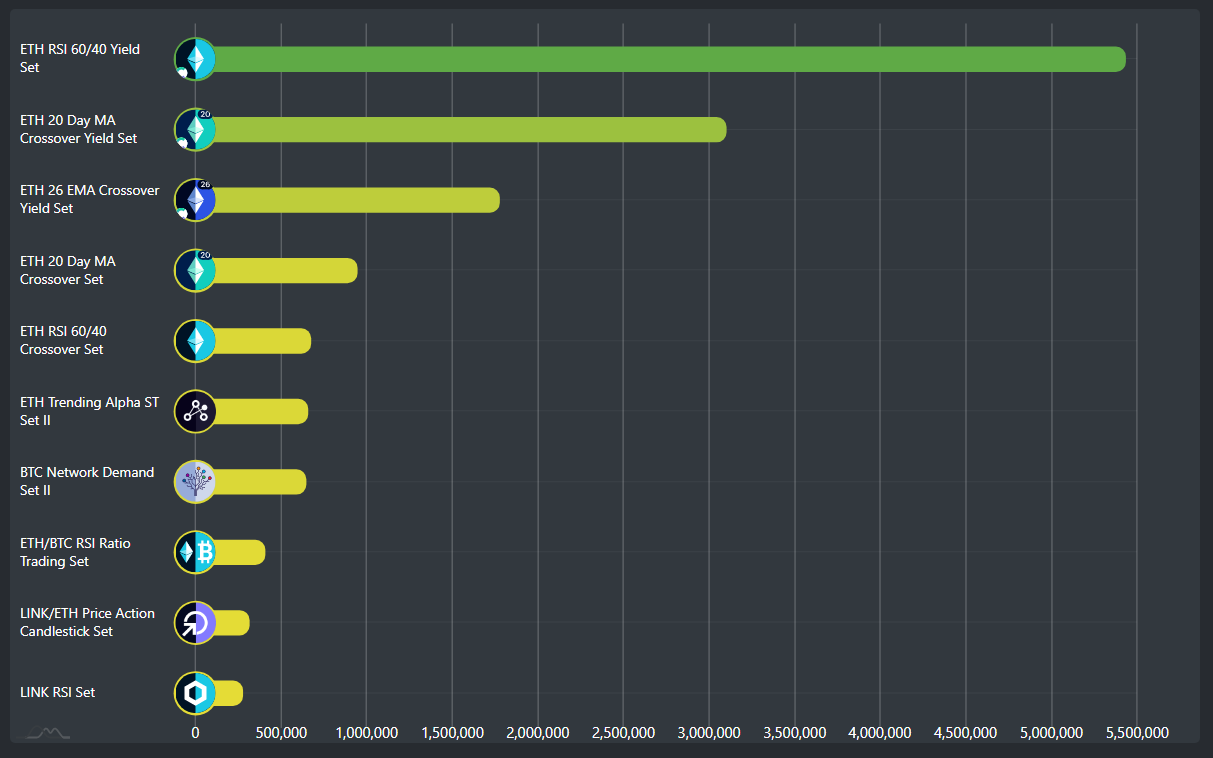
Set Social Trader Aaron Kruger recently started building out TokenViz - a website that visualizes various metrics using Set Protocol/TokenSets data. One of the sections of the website allows you to measure each Set against all possible metrics and plots this data in a top 10 list. Below, I've plotted each Set by USD market cap and you can clearly see that there is a Pareto distribution forming among Sets based on performance. The top 3 Sets listed are the best performing Robo Sets against ETH over the last 3 months with the RSI Set returning 66.2%, the 20 Day MA Set returning 50.7%, and the 26 Day EMA Set returning 44.4%.
TokenViz has also already become TokenSets' #4 source of referral traffic over its short life of around 2 weeks!
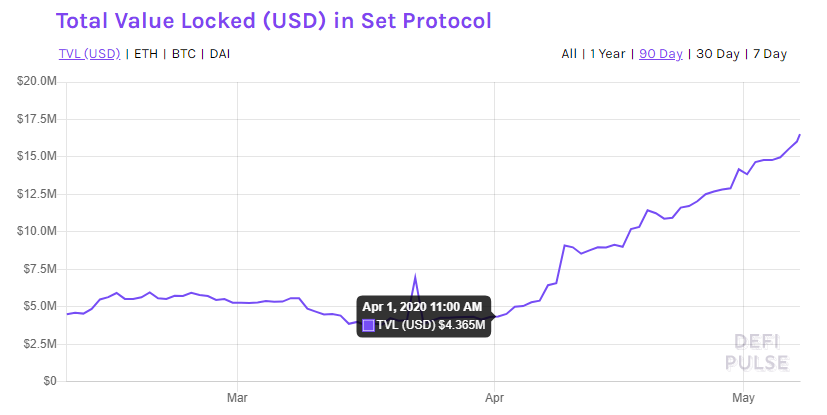
- Due to the out-performance of many of the Sets over the last few weeks as well as overall price appreciation, the Set Protocol Vault has grown from $4.3 million on April 1st to $17.5m at the time of writing which places Set Protocol at #8 on DeFi Pulse. As for where this value is allocated: $3m is currently positioned in the Social Sets with $14.5m positioned in the Robo Sets. We expect this to become more equal over time as the Social Trading Sets build up more of a performance history.