ON–025: DeFi
Coverage on MakerDAO, Synthetix, Set Protocol, and Balancer.
Jun 12, 2020

Click here to join the Our Network telegram chat. Welcome to issue #25 of Our Network, the free newsletter about on-chain analytics that reaches almost 2500 crypto investors every week.
This week our contributors cover MakerDAO, Synthetix, Set Protocol, and Balancer.
Contributor: Primož Kordež, Founder of BlockAnalitica
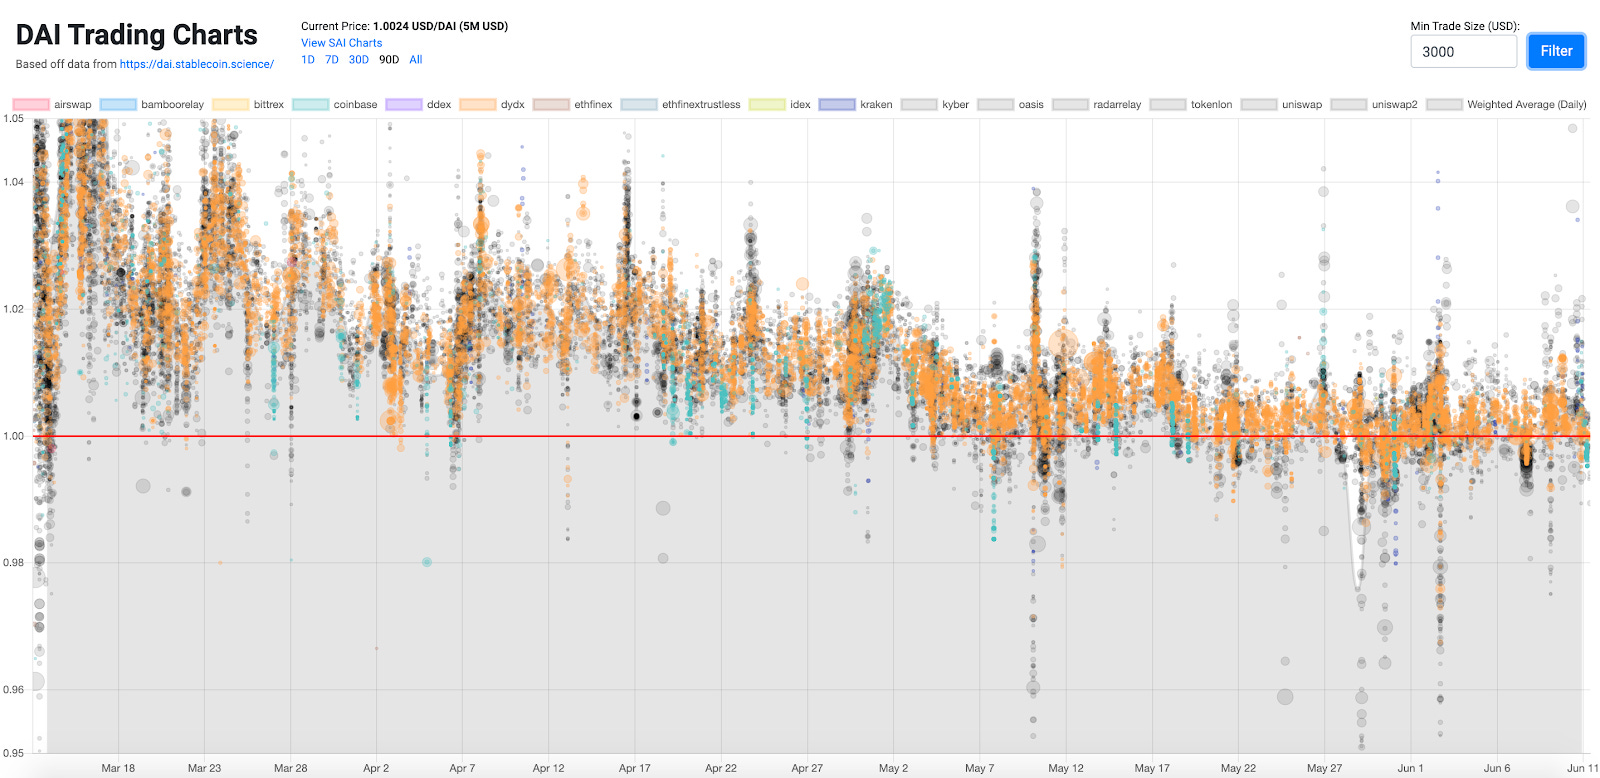
- Peg improvement. The Dai peg finally improved and its price reached dollar parity after 3 months following the Black Thursday event. Dai supply is currently sitting at 122m, a level last seen in March before the major liquidations happened that reduced the supply below the equilibrium needed for Dai price parity. Increased minting activity since then has mostly been associated with ETH price outperformance and the general positive sentiment surrounding crypto assets. Additionally, the inclusion of USDC and WBTC vaults have increased Dai supply, whereas low rates helped to bring demand down and make issuing Dai cheaper.
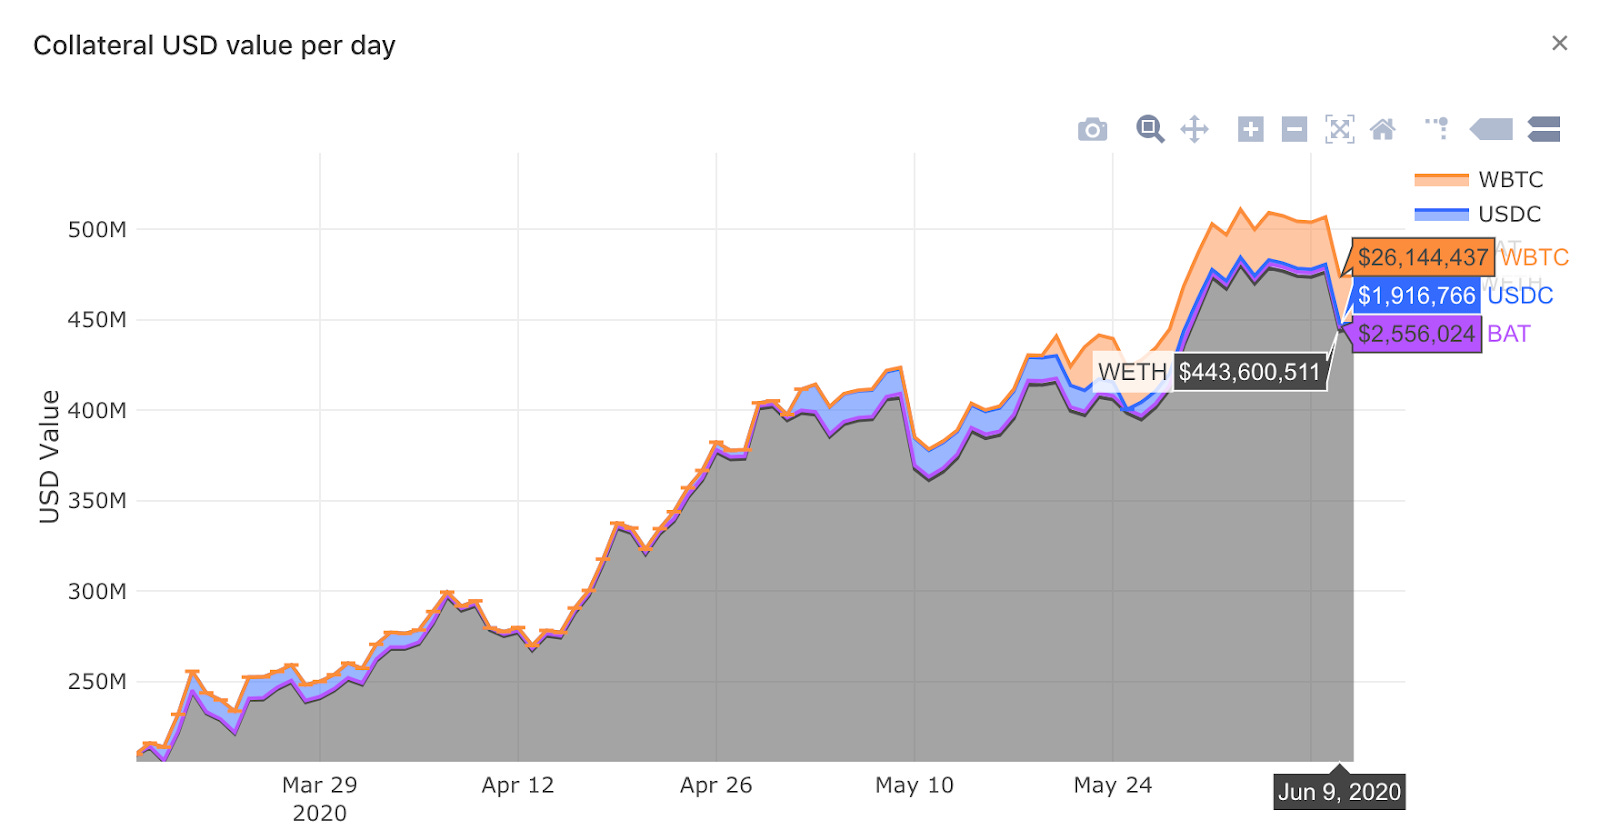
- An increase in ETH & WBTC borrowing activity and a decrease in USDC borrowing activity. USDC vaults have been utilized mostly by arbitrageurs trying to make yield on shorting Dai when Dai experienced price premium. We can see how USDC debt owners repaid their vaults as soon as increased minting activity happened by either ETH or WBTC vaults. This shows how important USDC vaults are when Dai supply isn’t met with demand and price deviates. Debt exposure dynamics of USDC vaults hence tells us a lot about equilibrium of Dai demand and supply.
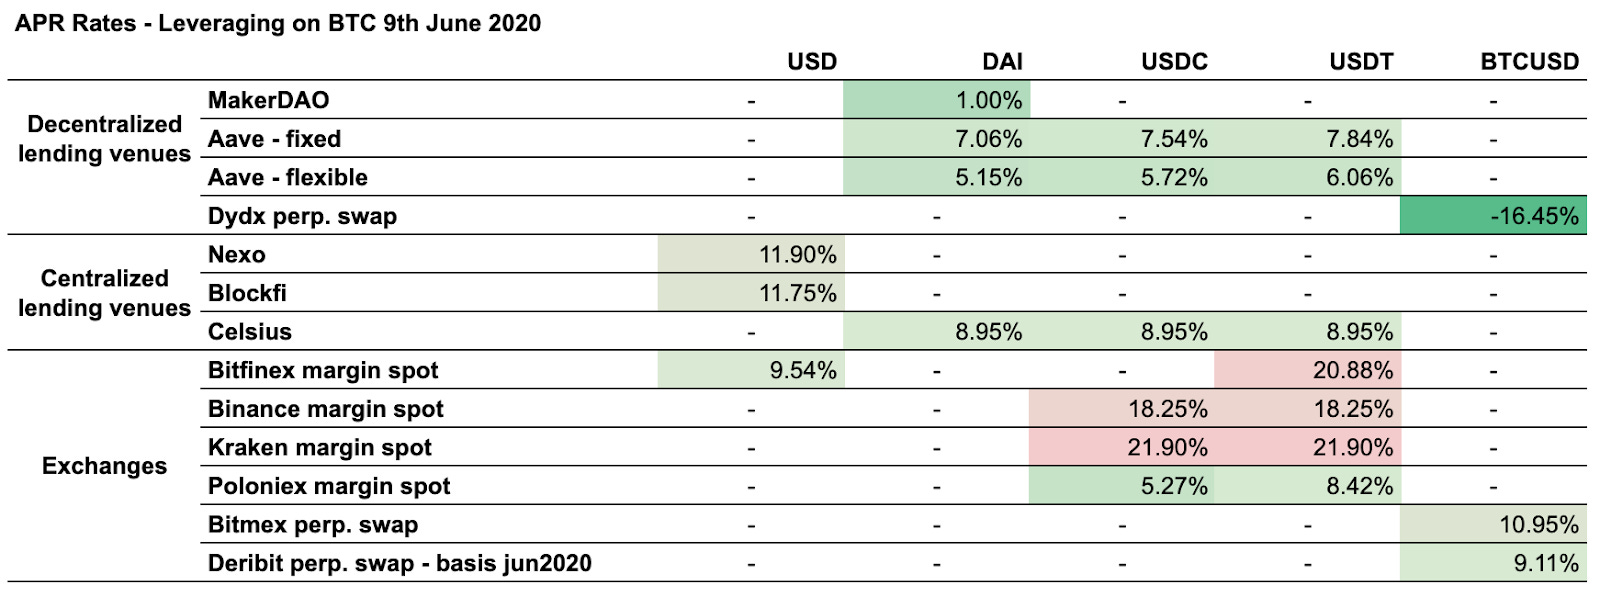
- Comparing USD borrowing rates for Bitcoin (BTC). Low rates at MakerDAO were set by governance to increase Dai minting activity, but this also had an effect of attracting existing leveraged traders (including those in “CeFi”) to refinance their debt exposure. We have seen one large WBTC vault user utilizing 93% of available 10m debt ceiling, as this user could borrow a USD-based stablecoin below the rates on other lending venues. It is important to note, however, that lending venues have different terms, and exchanges offer much higher leverage too, so rate comparisons would need to be adjusted for that.
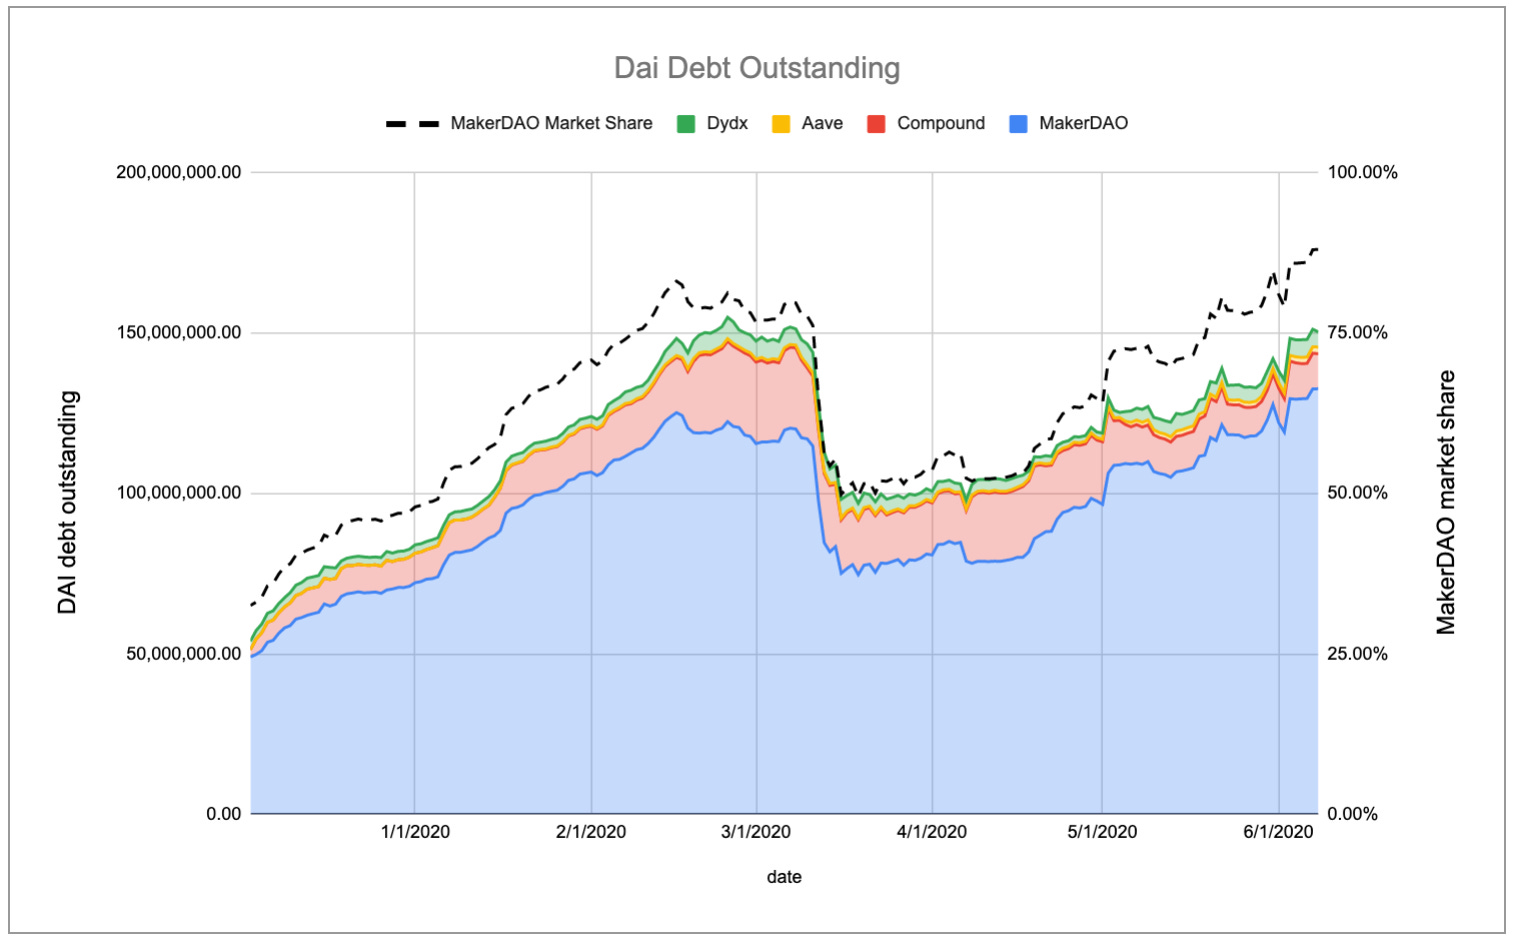
- MakerDAO marketshare. Dai supply is currently sitting close to ATH, thanks to low rates and positive price sentiment regarding ETH. The same holds true for MakerDAO marketshare in terms of Dai debt outstanding, as secondary lending venues cannot compete with 0% borrow rate. The remaining secondary lenders represent less than 10% of Dai debt borrowed. As soon as MakerDAO starts increasing rates, secondary lending venues should begin to attract borrowers again.
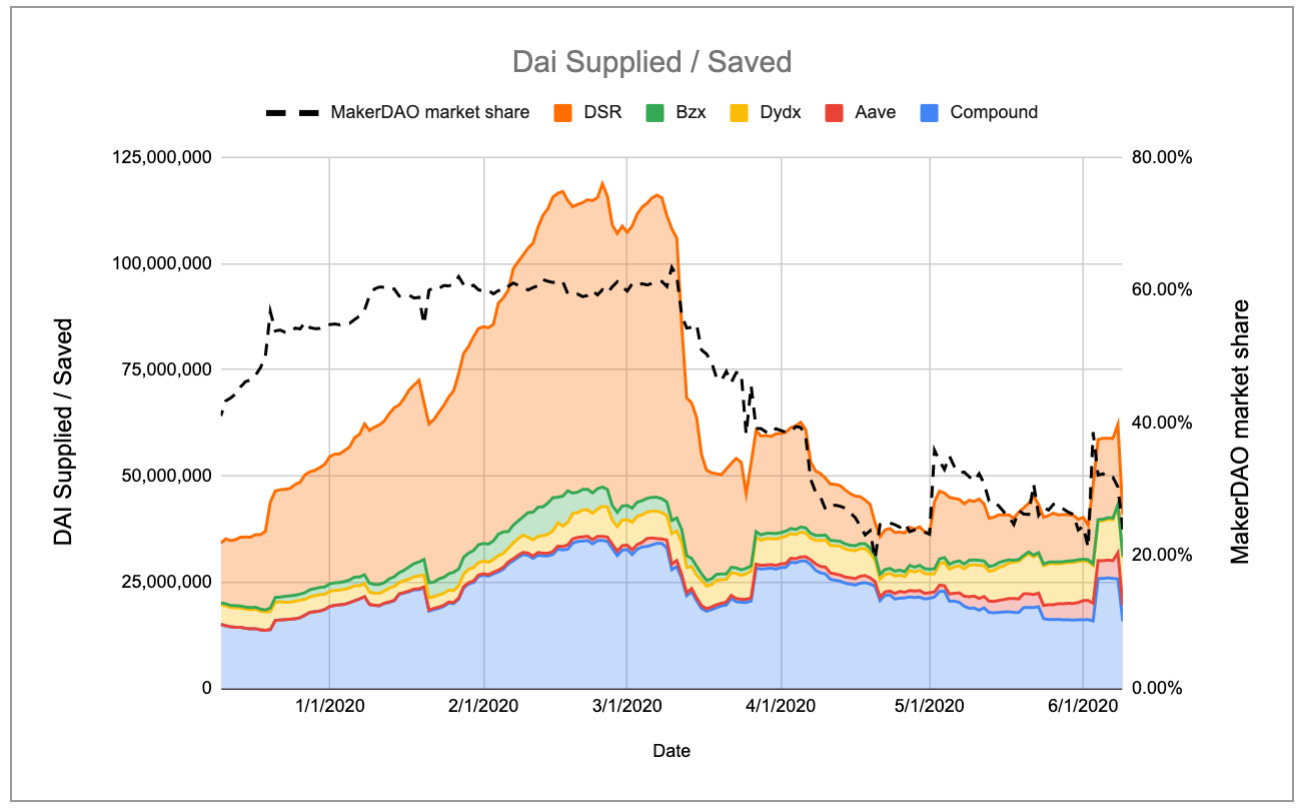
- The low-rate environment, however, has decreased the share of people saving Dai in the DSR compared to other lending venues. Share of Dai stored in the DSR is at all-time low, which was exactly the point of helping the peg to improve.
Contributor: Anthony Sassano, Product Marketing at Set Protocol
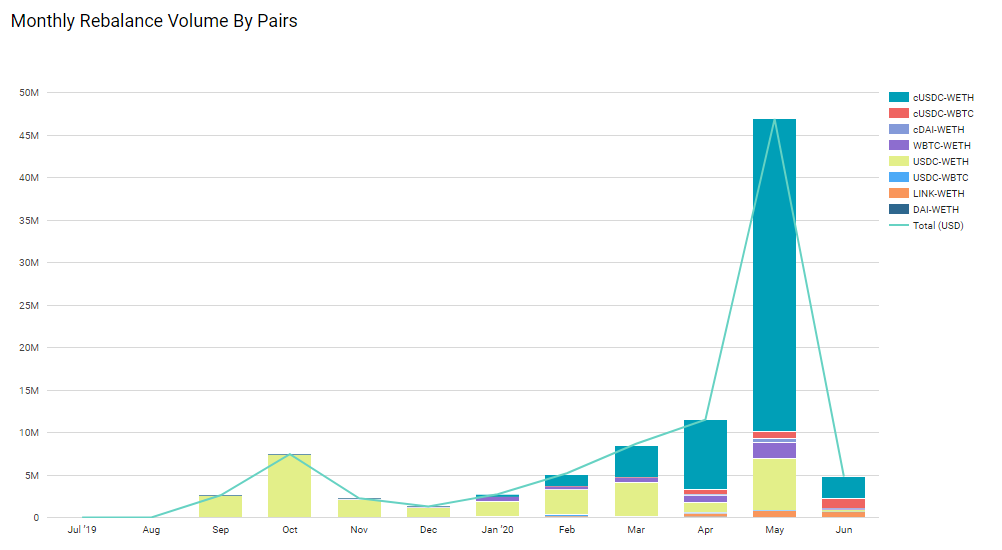
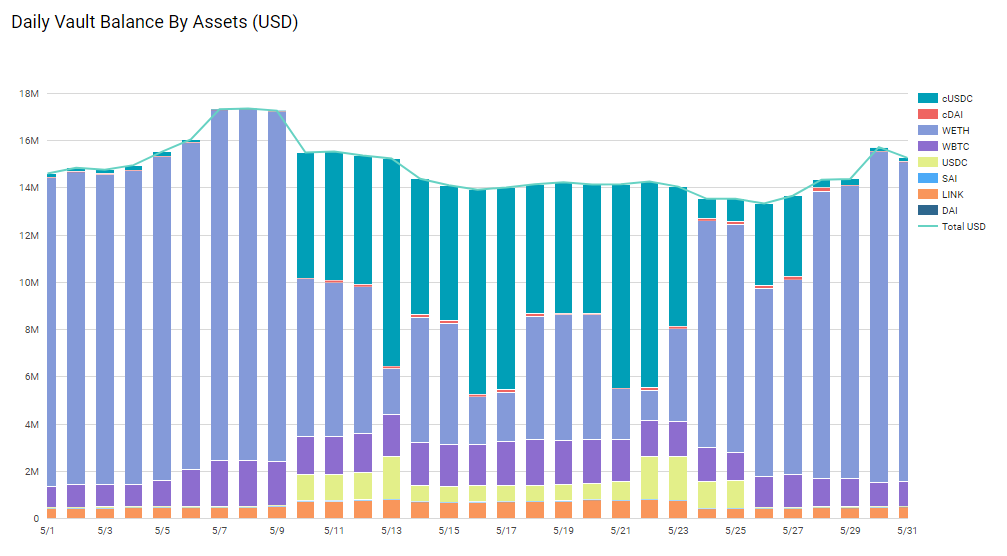
- Set Protocol rebalances hit an all time high in May with ~$47 million worth of crypto traded entirely on-chain. This was by far the largest monthly rebalance volume the protocol has ever seen. The largest Set by marketcap, the ETHRSIAPY, rebalanced twice in May which were both >$5mil on-chain trades (the biggest on Ethereum that we know of). Rebalance slippage has also tightened significantly for $1mil-$1.5mil trades and typically settle at around 0.3-0.5%.
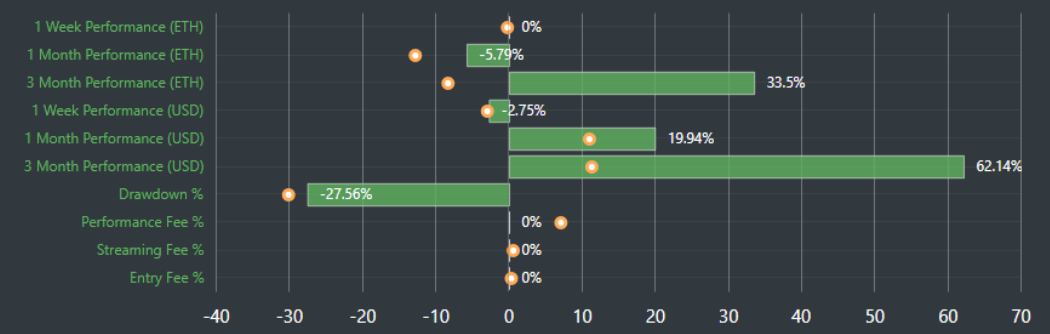
- TokenViz.io has a really great dashboard where each Set is benchmarked based on a "score" that is made up of a number of key indicators. Currently, the highest scoring Set is the ETH RSI 60/40 Yield Set (ETHRSIAPY) as it has the best performance out of any Set since inception, has no fees, and has a low drawdown % (compared to other Sets). Users can use this tool as a way to help them make more informed decisions when buying into a Set.
- May was a very choppy month for both the ETH and BTC markets which resulted in a fascinating pattern playing out across the different Sets. Nearly all of the Sets started the month very bullish but then half of them quickly changed their tune and went to cash after the market dipped on May 10th (ETH fell quickly from $210 to $180). Over the course of the next two weeks, a few of the bigger Robo Sets ended up getting chopped up by volatility in the ETH market before finally turning bullish towards the end of the month.
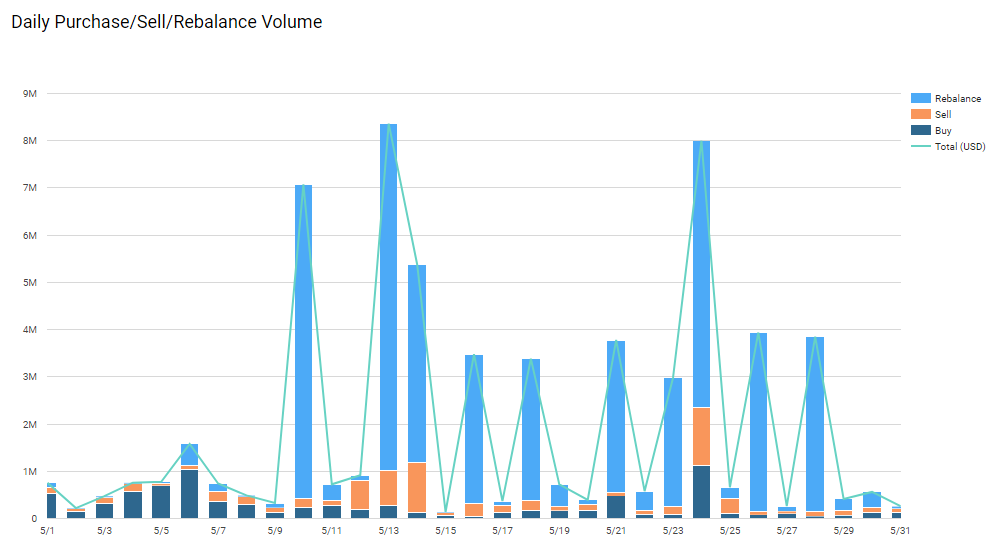
- This chart shows the daily buy, sell and rebalance volume for the protocol. What's interesting to note is that on days with large rebalance volumes, sell volume (orange) tends to spike. This is because some users "disagree" with a trade that a Robo Set or Social Trader has made and decides to exit the Set (normally because they perceive that it made a bad trade). This is always quite fascinating to our team because Sets killer use-case is that you simply "set and forget it" and don't need to do the trading yourself but obviously some of our users are opting to use Sets as actively managed instruments.
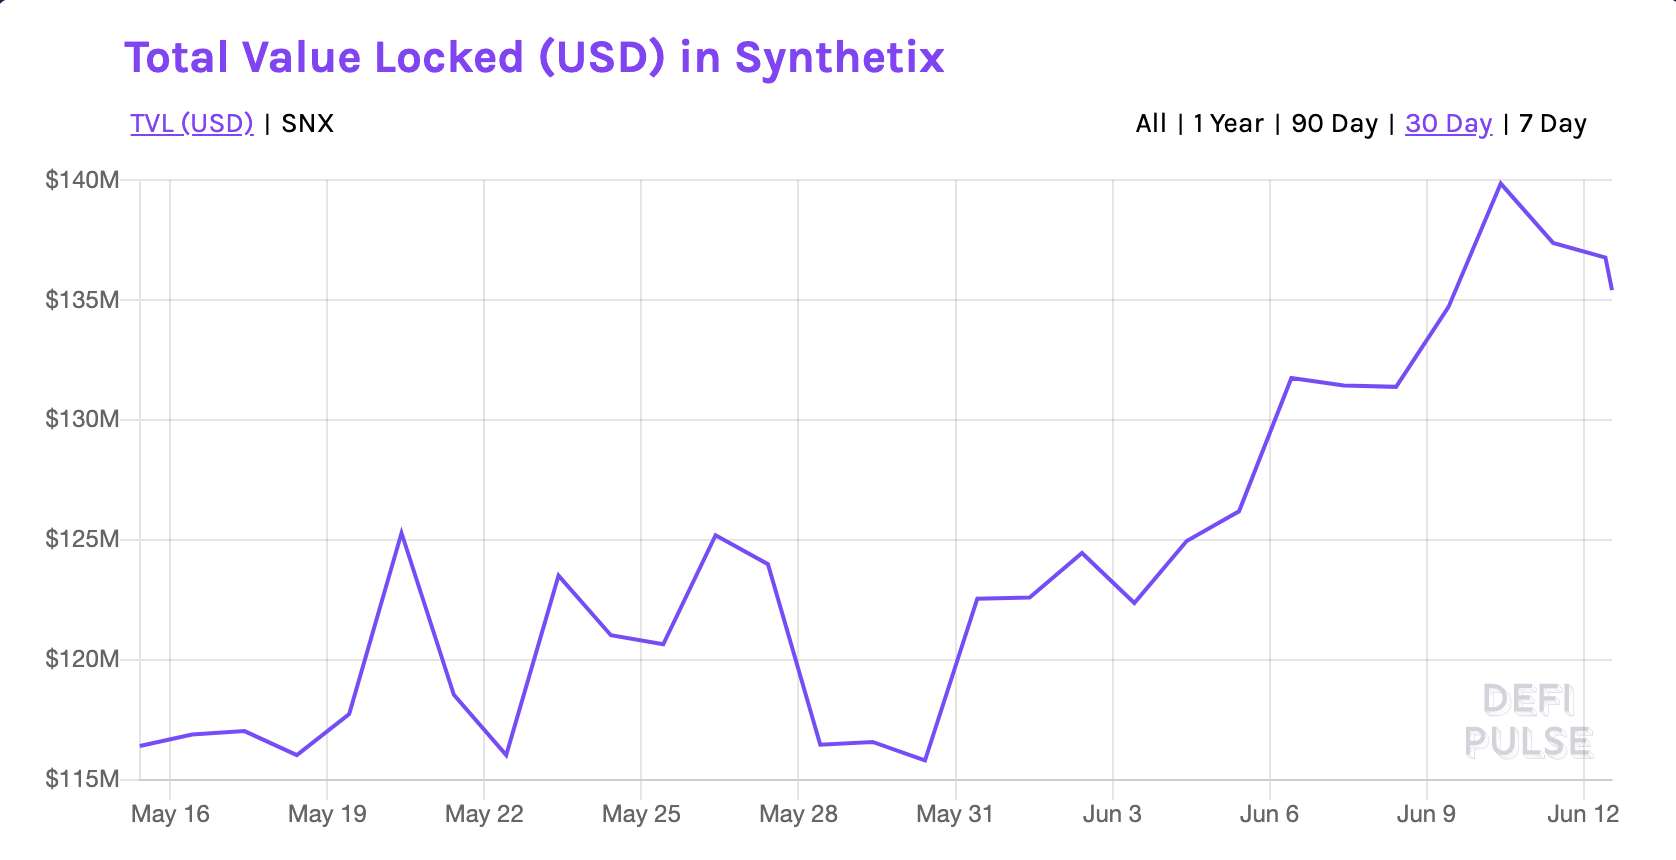
Contributor: Jordan Momtazi, Core Contributor at Synthetix
- This series will focus on data related to SNX Inflationary rewards which were introduced into the Synthetix network in March of 2018. Inflationary rewards are earned by staking SNX and issuing synthetic assets (Synths) against them. Stakers began earning rewards in April of 2019 with a 12 month lock up period built into the design. Since that time the total number of SNX has increased from 100,000,000 tokens to 189,061,308. The unlocking of the inflationary supply has been eagerly watched by the community, waiting to see what impact vesting would have on network health and Staker dynamics.
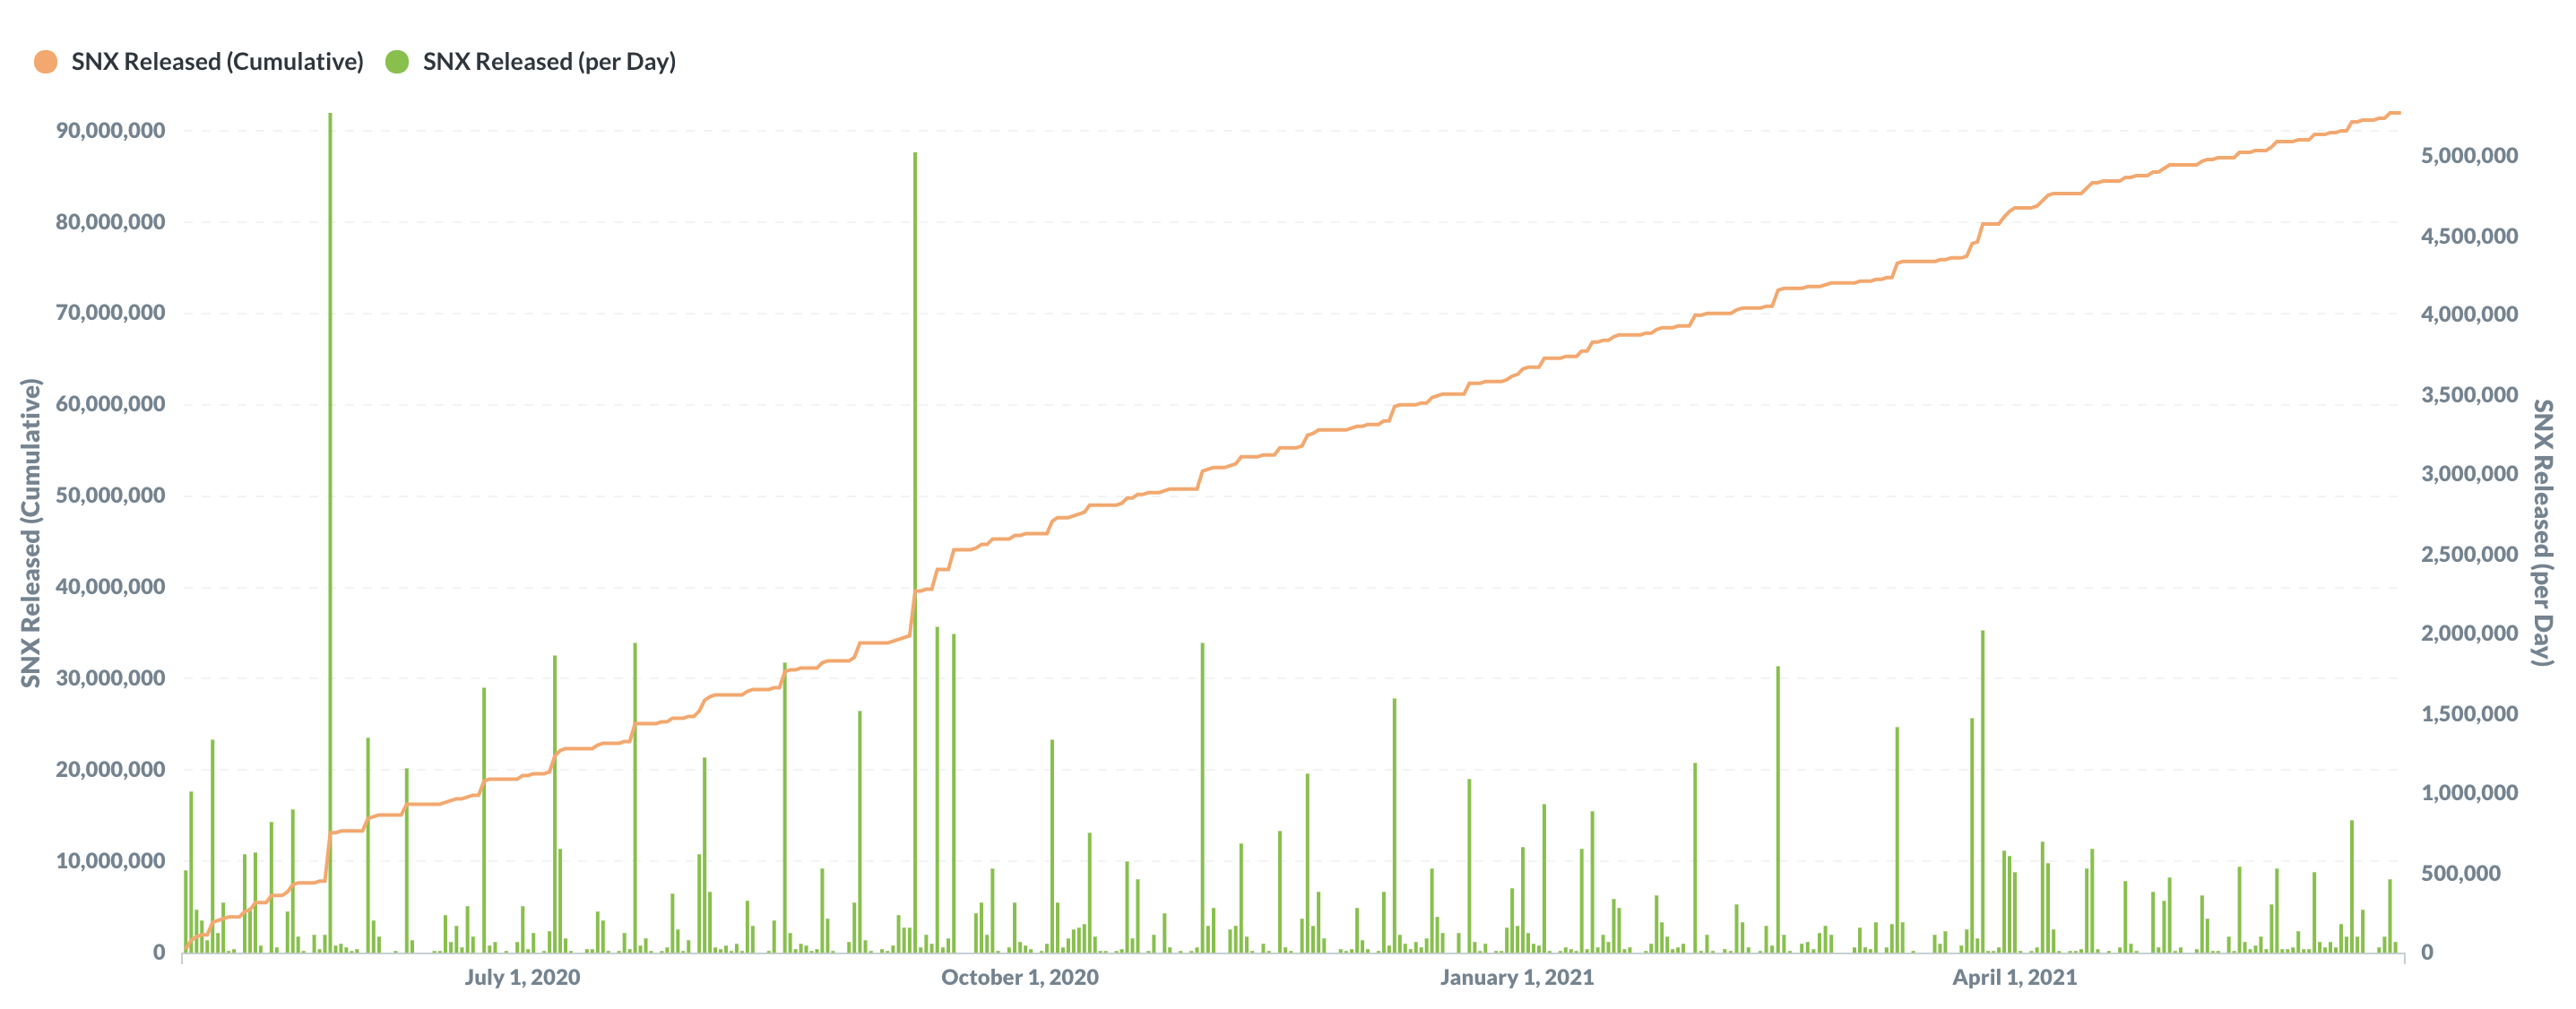
- The unlocking schedule can be seen below, with both cumulative and daily numbers represented. The first set of tokens (522,194 SNX) unlocked on April 30th, while the first large daily releases were May 5th with 1.35m SNX and May 27th with 5.27m SNX. The other interesting data point is the clustering of releases which mostly correspond to the reward claim cycle, past and present. The claim period has been shortened from two down to one week, which is reflected in the chart from late March 2021 onwards.
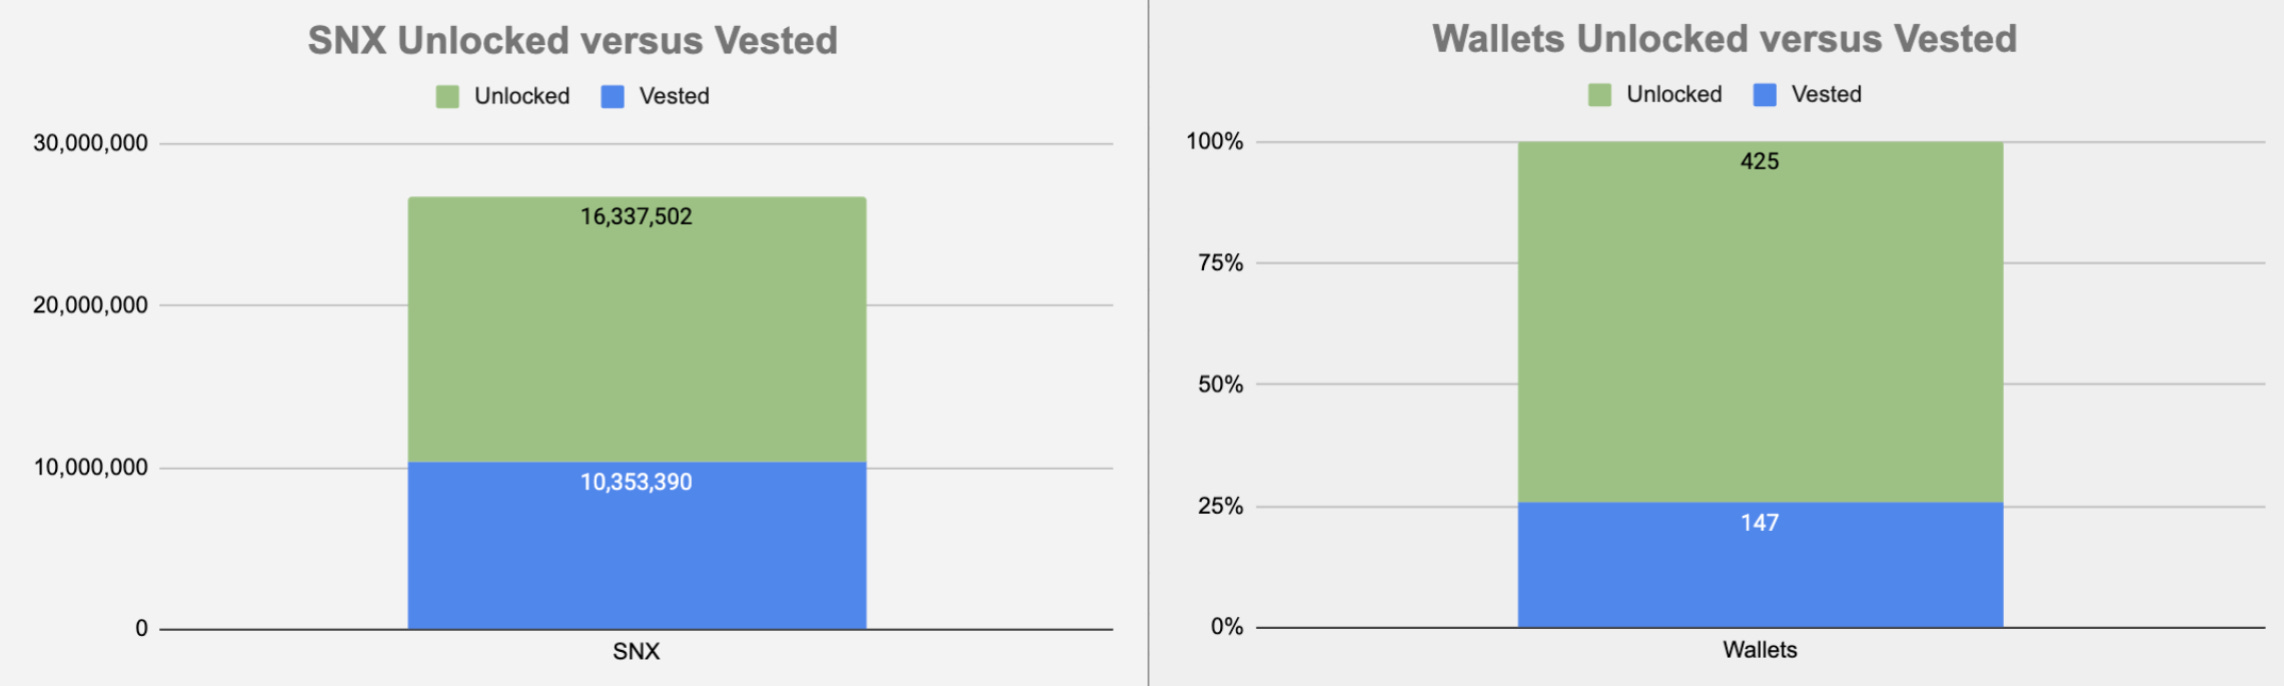
- The total number of unlocked inflationary reward tokens (to date) is 16,337,502 SNX, which is distributed across 425 wallets. Out of these tokens, 10,353,390 have been manually vested by 147 wallets. This process involves using Mintr to withdraw from the escrow contract to deposit into your own. Having a relatively small percentage of unlocked plus vested wallets provides some insight into the psychology of Stakers. Vesting does not provide any significant benefits for Stakers that are long the system and there to provide collateral to the network. Regardless of locked or otherwise, any SNX that is attributed to their address can be used as collateral and therefore helps to maximize the Stakers yield. Vesting becomes a mandatory step for those who want to move tokens and this has not played out in any meaningful way up until this point.
- There was much debate around the impact of additional circulating SNX, once the unlocking period began in April. With 16m SNX now unlocked it’s clear the impact has been minimal with collateral value increasing over the corresponding period. This is an important dynamic for the health of the network as Synthetix looks to expand the range and circulating value of decentralized synthetic assets.
Contributor: Fernando Martinelli, Co-founder & CEO at Balancer Labs
- Since June 1st, Balancer has been distributing governance tokens ($BAL) weekly to LPs (liquidity providers) to accelerate protocol decentralization and also as an incentive to bootstrap liquidity in its pools. This incentive hasn’t gone unnoticed. Balancer experienced staggering growth across all metrics and now boasts $32M of total liquidity, up from $6M in late May. It has recently outgrown the liquidity of both Uniswap V1 ($31M) and V2 ($27M) individually. 5 Balancer pools have surpassed the $1M mark in liquidity and 30 pools hold at least $100k. The protocol accounts for 2 of the top 5 AMM pools across DeFi.
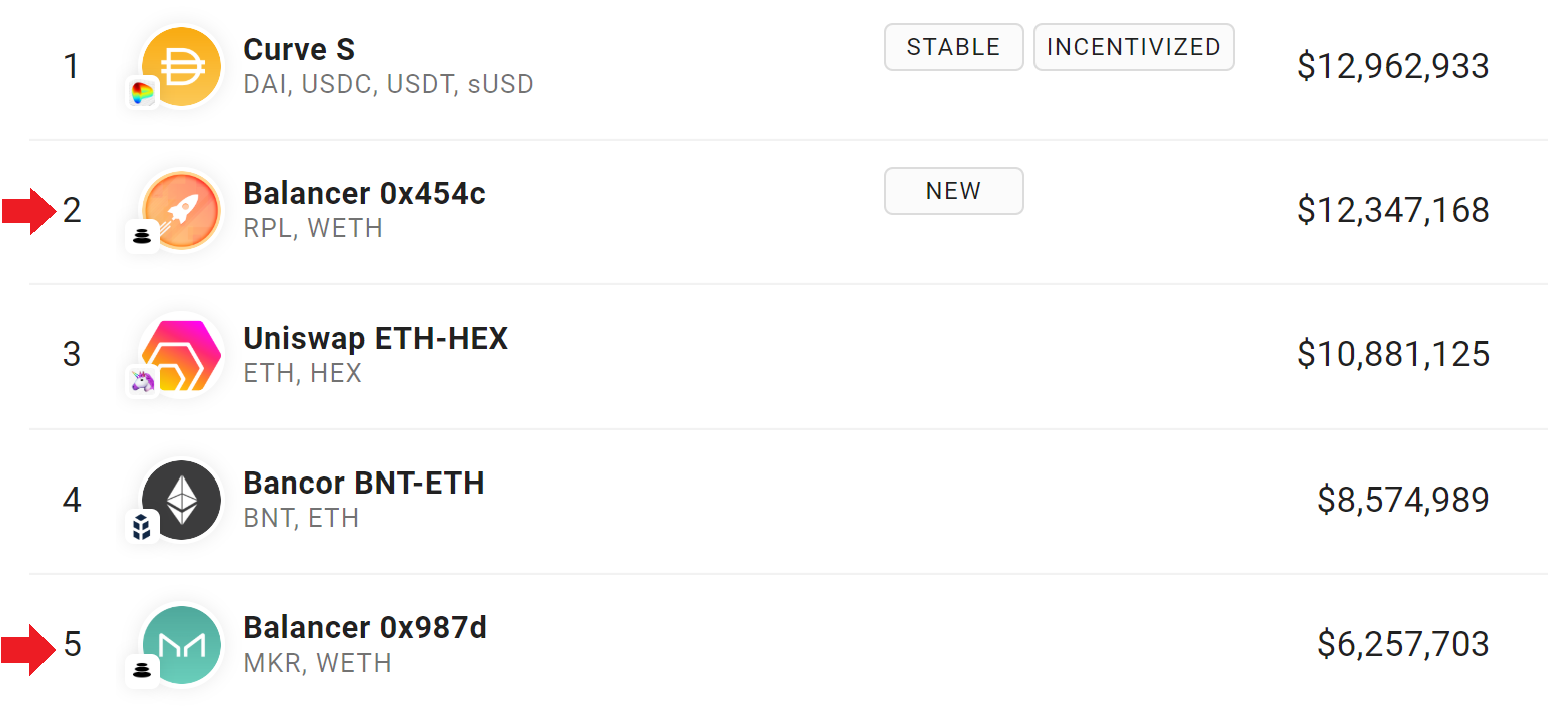
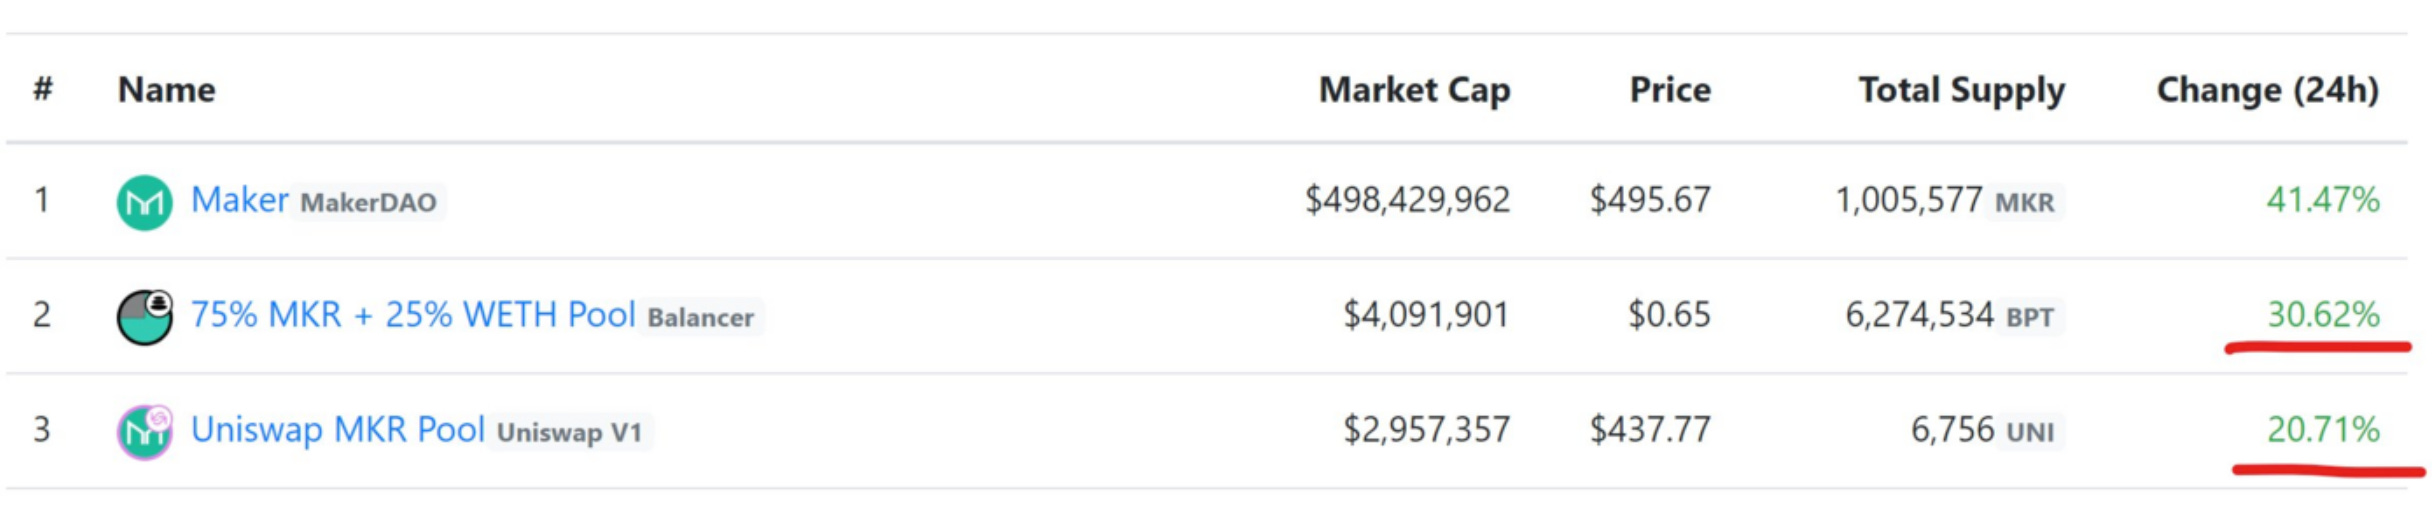
- The “MKR Bull” pool (75% MKR / 25% WETH) has established itself as the most liquid venue for MKR trading across DeFi. With the surge of MKR in relation to ETH due to the recent Coinbase listing, the pool configuration (being uneven) allowed for LP shares of the MKR Bull pool to more closely track the price of MKR when compared to shares of the more rigid 50/50 pools. Indeed this was the case during May 29th, when the screenshot below was taken. On that day, MKR surged 41% in USD terms. As one would expect, this 33% increase on the price of MKR relative to ETH resulted in different impermanent losses: 1.01% for the 50/50 Uniswap pool and only 0.72% for the 75/25 Balancer pool.